Ethereum price primed for a 35% nosedive amid crypto market-wide correction
- Ethereum price nears the end of a rising wedge pattern, hinting at a 35% drop soon.
- The number of ETH whales is on the decline adding credence to the bearish thesis.
- A bullish scenario might come into the picture if the supply barrier at $1,760 is invalidated.

Ethereum price slipped into a rising wedge formation since it first tapped the previous all-time high on January 19. Since then, ETH has been sloping up, forming higher highs and higher lows.
However, this steady uptrend took a u-turn as the sell-off snowballed after hitting a new high of $1,877 on February 13.
Ethereum price rally weakens as sell-off intensifies
Ethereum has been trading in a rising wedge formation for almost a month. The technical formation is a bearish setup where prices slope up while the volume declines, forming a bearish divergence. A breakout from the rising wedge lower trendline would forecast a correction towards the first pivot high. In this case, that target is $1,040, or a 35% drop.
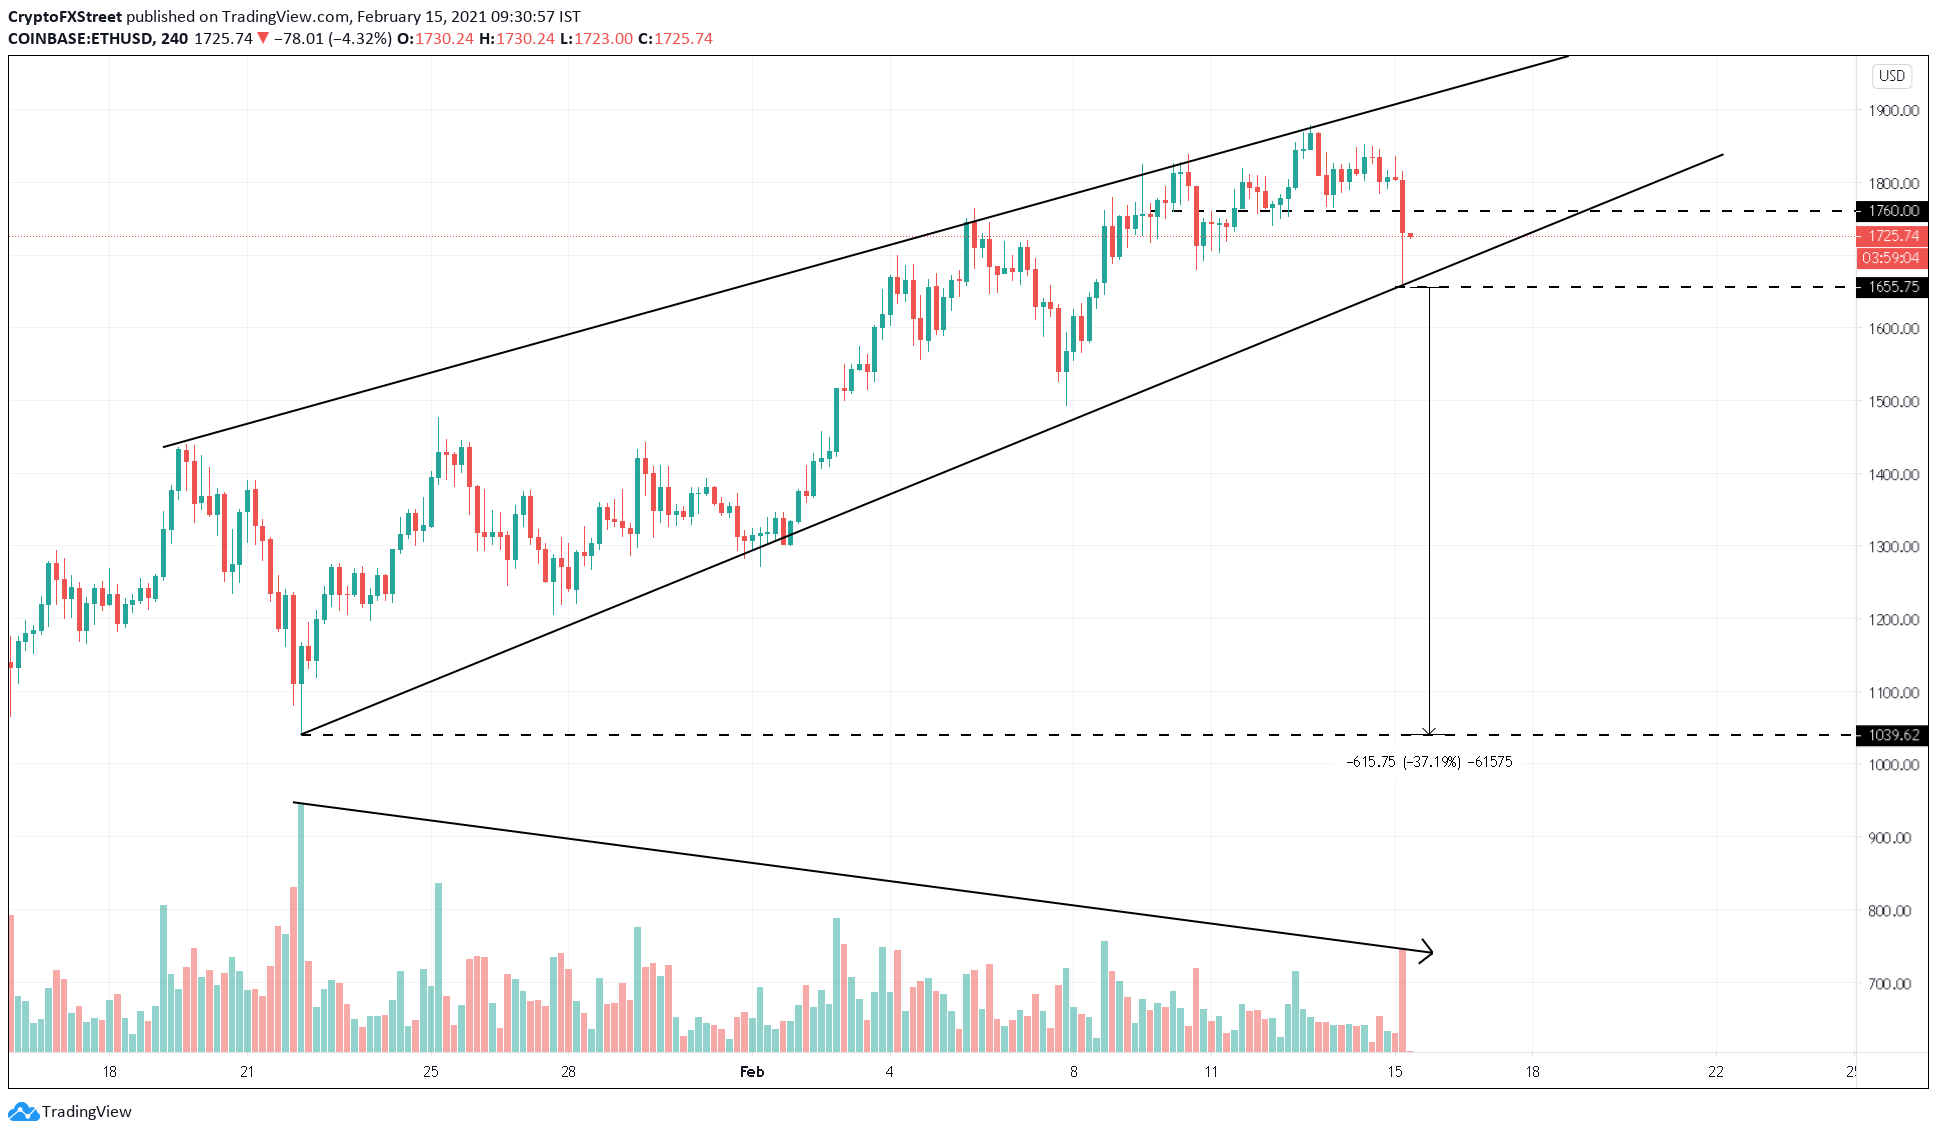
ETH/USD 4-hour chart
IntoTheBlock’s In/Out of the Money Around Price (IOMAP) model shows that a close below $1,655 would invalidate the support barrier at $1,700, where 2.25 million ETH purchased by 140,000 addresses are underwater.
Hence, the resulting spike in selling pressure would result in a breakout of the rising wedge pattern pushing the ETH towards a target of $1,050.
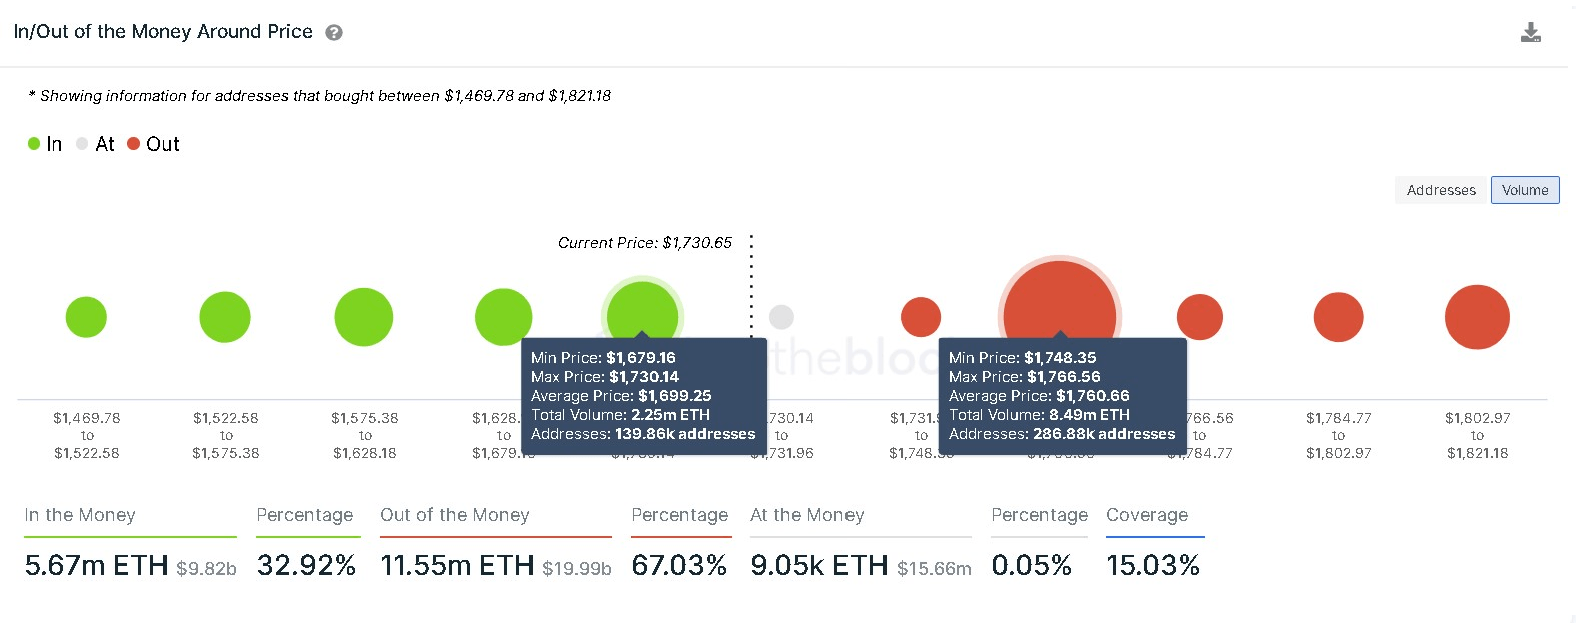
Ethereum IOMAP chart
GIOM indicates that 4 million addresses previously purchased roughly 11.35 million ETH around the $1,050 level further supporting the bearish thesis.
Besides, the number of whales holding 100,000 to 1 million ETH saw a 1.25% decline to 159 between February 13 and 15. A further drop in the number of these holders would add to Ethereum’s already bearish outlook.
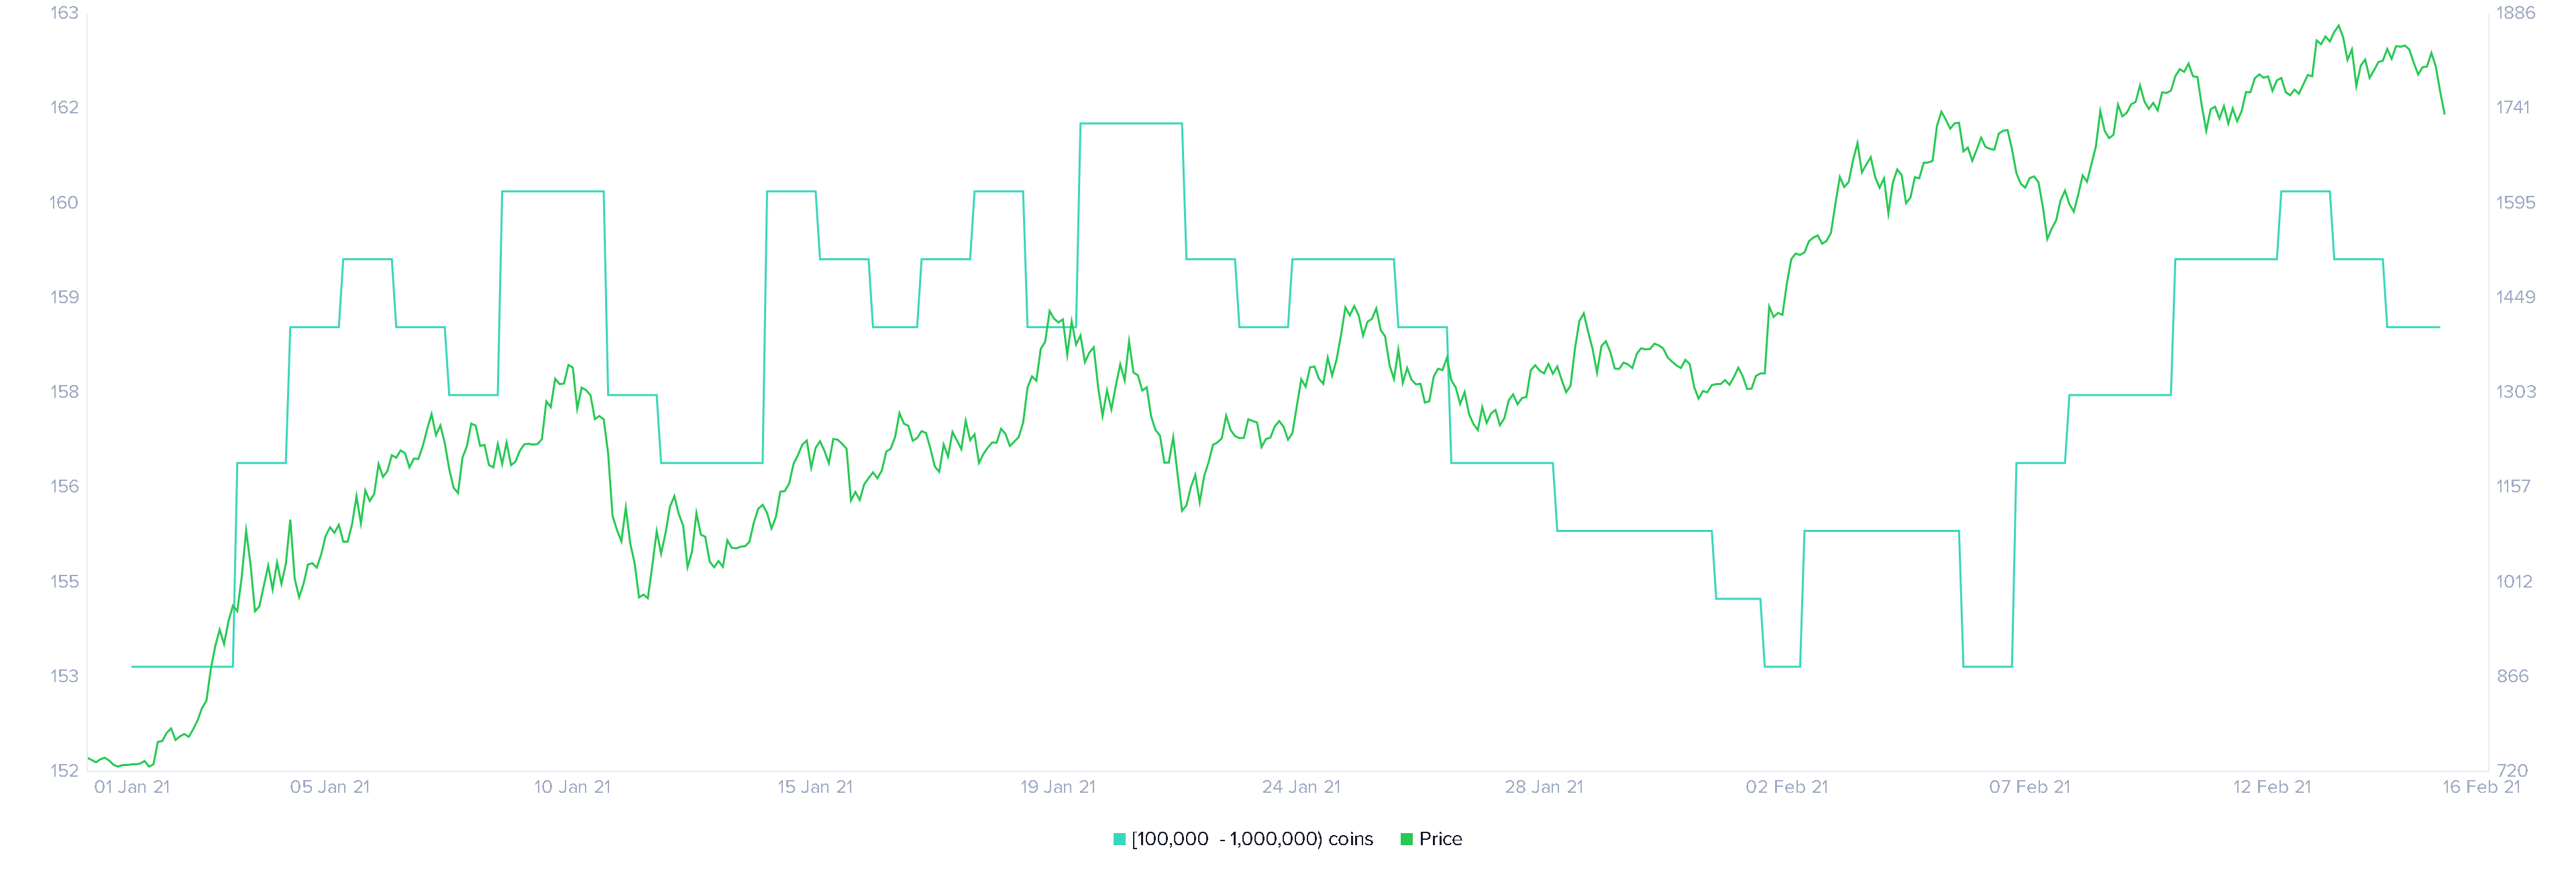
Ethereum Holders Distribution chart
However, a reversal in price may be possible if ETH fails to close below the rising wedge’s support line at $1,655.
Exchange addresses holding Ether have another plan
The number of ETH held on top exchange addresses has seen a large-scale reduction recently. This decline suggests that investors are confident in the smart contract platform's bullish potential. The ETH held by these addresses has shrunk nearly 52% from 25 million in July 2020 to 12 million in February 2021, while the prices saw a 335% appreciation.
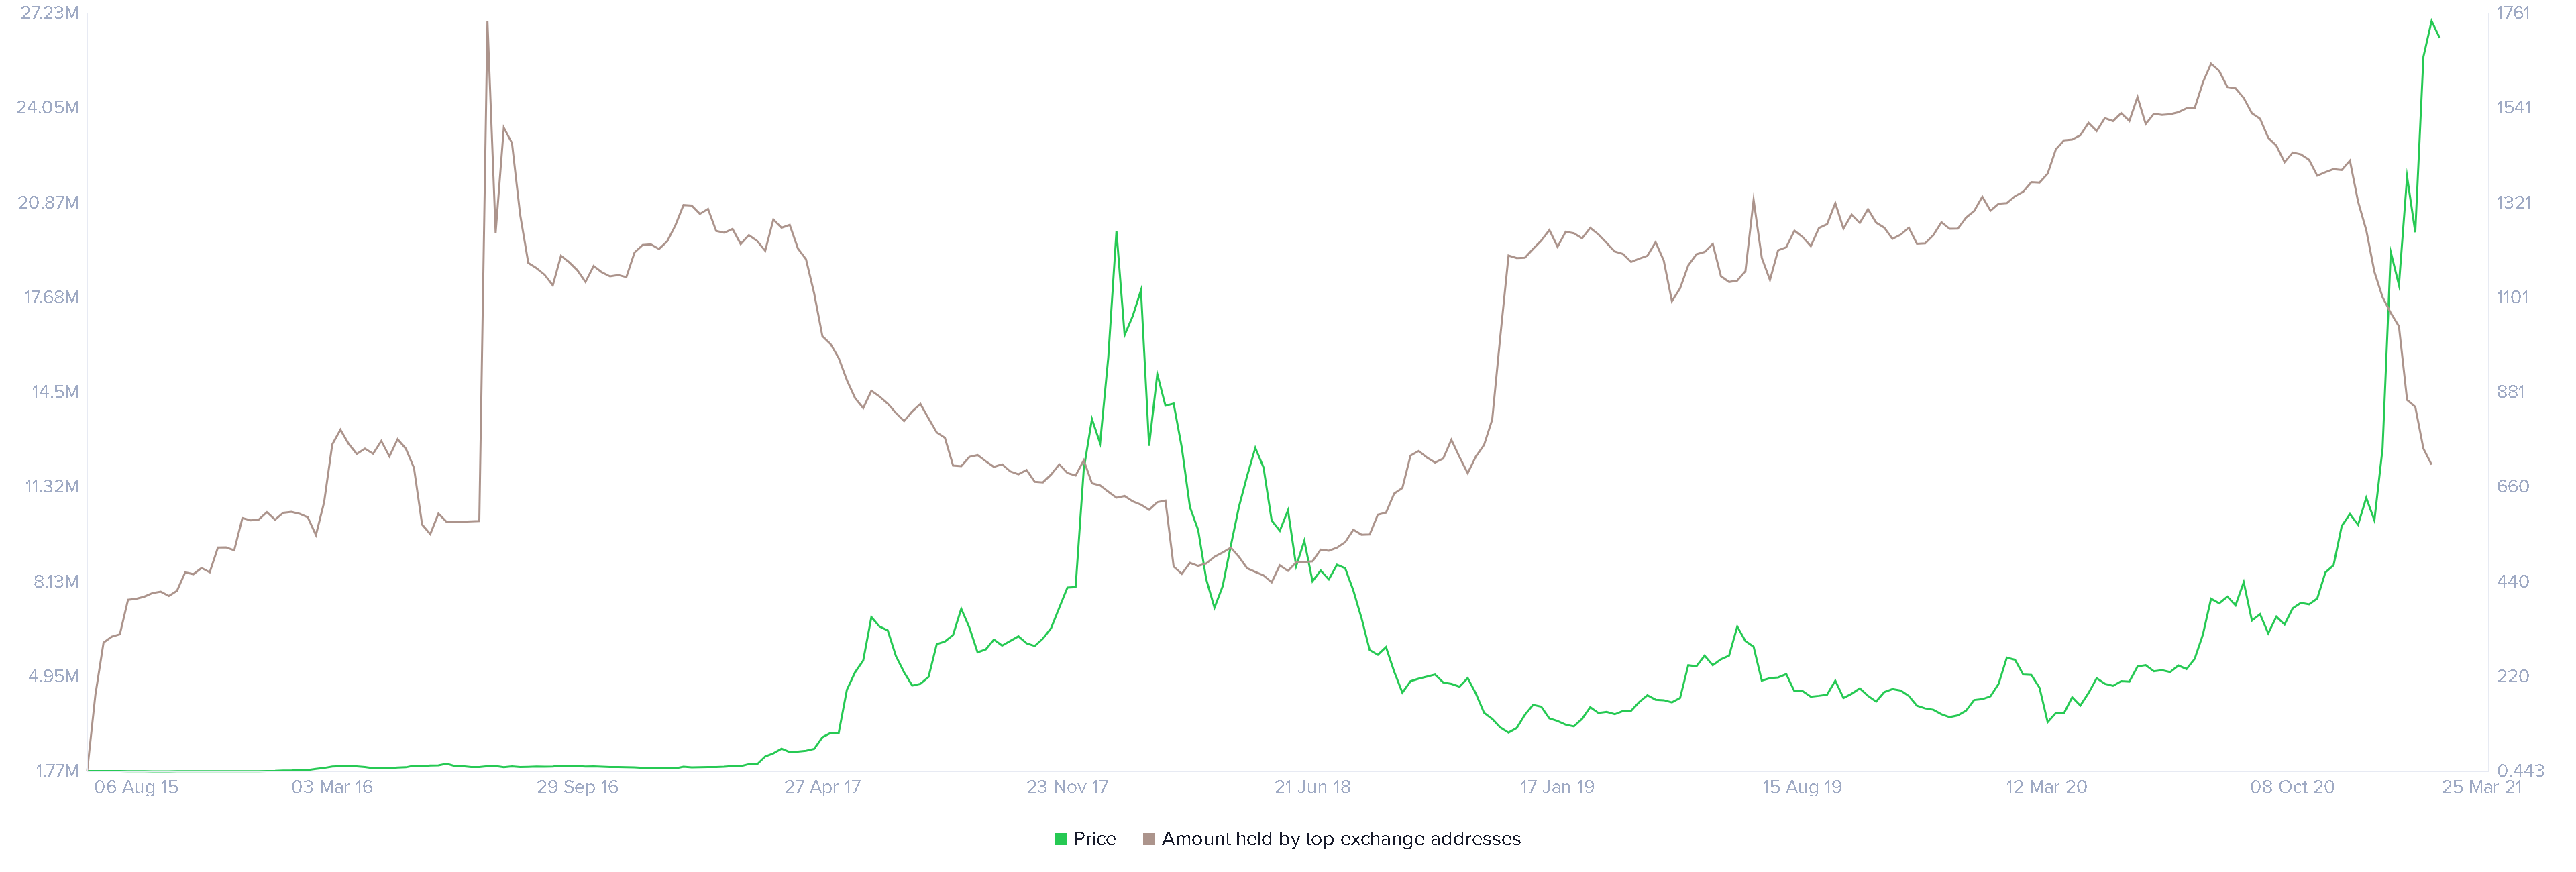
Ethereum held by top exchange addresses chart
The last time these addresses dropped almost 47% between August 2016 and August 2017, Ethereum price rose a massive 3,050%. Hence, if something similar was to happen, ETH can be expected to surge violently.
Therefore, a sudden spike in buying pressure around the $1,655 level leading to a close above the $1,760 resistance barrier would alleviate the short-term bearish outlook.
However, a close above the rising wedge’s upper trendline would indicate the bearish thesis’ invalidation and project the re-entry of Ethereum into price discovery mode towards the $2,200 level.
Author

Akash Girimath
FXStreet
Akash Girimath is a Mechanical Engineer interested in the chaos of the financial markets. Trying to make sense of this convoluted yet fascinating space, he switched his engineering job to become a crypto reporter and analyst.


