Ethereum Price Analysis: ETH hovers near all-time highs but risks breakdown to $1,700
- Ethereum’s uptrend towards $2,000 stalls above $1,800 as decline lingers.
- A rising wedge pattern and a potential sell signal hint at a possible correction.
- As revealed by the IOMAP model, lack of formidable resistance means that the breakdown could fail to materialize.

Ethereum has in the last couple of days traded near all-time highs but has made little progress towards the much anticipated all-time highs. The flagship smart contract token is teetering at $1,840 amid a potential retreat.
Ethereum is on the brink of a massive correction
Ether is trading at the apex of a rising wedge pattern suggesting that a breakdown may come into the picture. This technical pattern is bearish and indicates potential trend reversals. If validated, ETH could dive towards the 50 Simple Moving Average (SMA) support on the 4-hour chart. If declines increase the intensity, Ethereum will most likely drop to the 100 SMA close to $1,600.
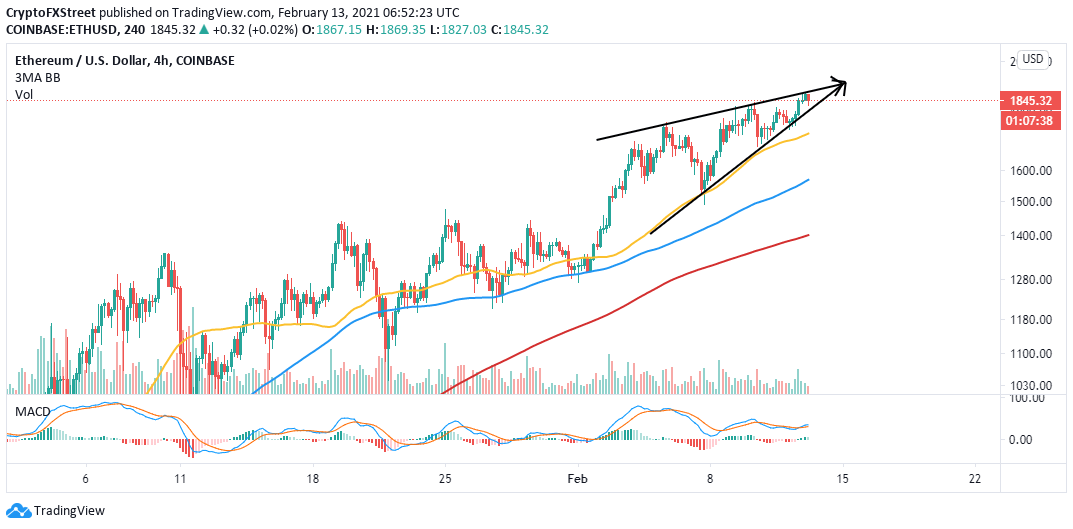
ETH/USD 4-hour chart
The TD Sequential indicator will likely present a sell signal on the 3-day chart in the coming few days. This call to sell will manifest in a green nine candlestick. If it is validated, ETH may drop in one to four daily candles. Hence, it is worth keeping an eye on the 3-day chart to time a potential correction accurately.
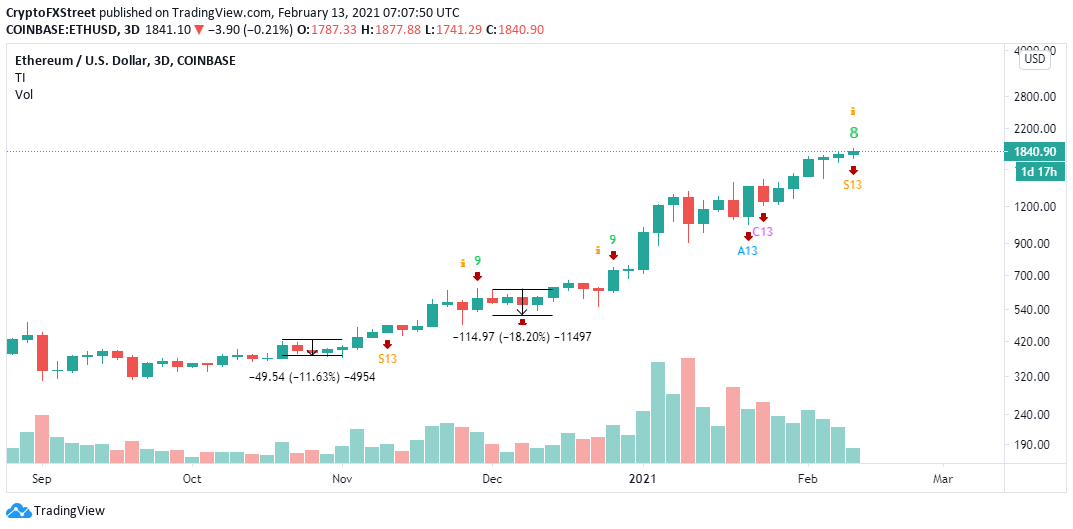
ETH/USD 3-day chart
Looking at the other side of the fence
According to the IOMAP chart, all Ethereum addresses are in profit. Therefore, no defined resistance lies ahead of the pioneer altcoin token. In other words, Ethereum only needs a boost above the all-time high to hit new record highs, perhaps above $2,000.
-637487985975606007.png)
Ethereum IOMAP model
On the other hand, Ethereum is sitting on an area with immense support, which could be strong enough to sabotage the potential downfall. For example, the most robust buyer congestion zone runs from $1,678 to $1,733. Here, nearly 148,000 addresses had previously bought 8.1 million ETH. It is doubtful that losses will exceed this zone.
Author

John Isige
FXStreet
John Isige is a seasoned cryptocurrency journalist and markets analyst committed to delivering high-quality, actionable insights tailored to traders, investors, and crypto enthusiasts. He enjoys deep dives into emerging Web3 tren


