Ethereum Price Prediction: ETH/USD rally to $430 overdue – Confluence Detector


  • Ethereum in consolidation as it faces the toughest resistance at $239 as the confluence detector tool.
  • ERC-20 tokens market capitalization surpassed that of Ethereum indicating increased blockchain adoption.
  • Ethereum is poised for a rally according to a cryptocurrency analyst’s highlighted factors.

Ethereum is still stuck in consolidation under $240. Support is provided by the 50-day SMA and the key ascending trendline. The technical picture is likely to remain unchanged based on applied technical indicators like the RSI, the MACD and the volume indicator.

The MACD is holding tightly to the midline (0.00). It has been pivotal in the same position since the beginning of July. Consequently, the RSI is moving sideways above the average. Unlike the MACD which is flat at the midline, the RSI has a bearish inclination. In other words, sellers are gaining traction in the short term.

ETH/USD daily chart

ETH/USD price chart

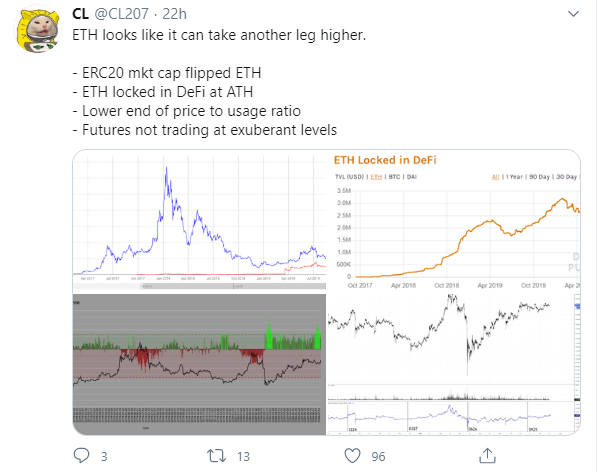
According to a cryptocurrency analyst on Twitter, “ETH looks like it can take another leg higher” in spite of the stalling at $240 and the seller congestion at $245. Some of the factors ‘CL’ the analyst points out in support of a rally include:

  • ERC-20 tokens market cap surpasses Ethereum market share: This shows that adoption is on the rise highlighting the importance of Ethereum as a blockchain solution provider.
  • DeFi boom: The amount of Ether coins locked in the decentralized finance ecosystem has hit an all-time high of 3.4 million as per the data released by DefiPulse. In other words, over 2.5% of the Ethereum circulating supply is locked in DeFi.
  • Ethereum is holding at the “lower end of the price to usage ratio” according to data released by analytics platform, Santiment.
  • ETH futures contracts trading is currently at levels just a few percentage points past the spot rate.

fxsoriginal

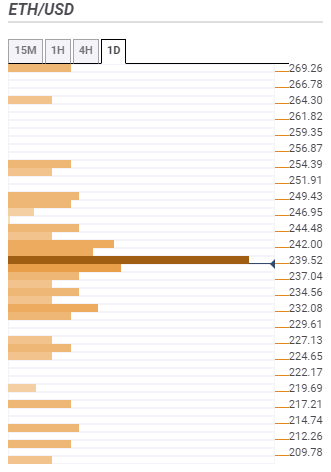
Ethereum confluence support and resistance levels

According to the confluence tool, Ethereum is facing a single but strongest resistance at $239.52. The zone is home to multiple technical indicators including the previous high 15-minutes, the SMA five 4-hour, the Fibonacci 38.2% one-day, the Bollinger Band 1-hour middle, the SMA 100 15-minutes and the previous high 4-hour among others. Other miles resistance areas above $240 include $242, $244.48 and $249.43. A far as support is concerned, Ethereum is hanging at the edge of a cliff. Only mild support areas can be observed by the tool. Some of them include $237.04, $234.56 and $232.08.

fxsoriginal


Information on these pages contains forward-looking statements that involve risks and uncertainties. Markets and instruments profiled on this page are for informational purposes only and should not in any way come across as a recommendation to buy or sell in these assets. You should do your own thorough research before making any investment decisions. FXStreet does not in any way guarantee that this information is free from mistakes, errors, or material misstatements. It also does not guarantee that this information is of a timely nature. Investing in Open Markets involves a great deal of risk, including the loss of all or a portion of your investment, as well as emotional distress. All risks, losses and costs associated with investing, including total loss of principal, are your responsibility. The views and opinions expressed in this article are those of the authors and do not necessarily reflect the official policy or position of FXStreet nor its advertisers. The author will not be held responsible for information that is found at the end of links posted on this page.

If not otherwise explicitly mentioned in the body of the article, at the time of writing, the author has no position in any stock mentioned in this article and no business relationship with any company mentioned. The author has not received compensation for writing this article, other than from FXStreet.

FXStreet and the author do not provide personalized recommendations. The author makes no representations as to the accuracy, completeness, or suitability of this information. FXStreet and the author will not be liable for any errors, omissions or any losses, injuries or damages arising from this information and its display or use. Errors and omissions excepted.

The author and FXStreet are not registered investment advisors and nothing in this article is intended to be investment advice.

Join Telegram

Recommended content


Recommended Content

Editors’ Picks

Ethereum dips slightly amid Renzo depeg, BlackRock spot ETH ETF amendment

Ethereum dips slightly amid Renzo depeg, BlackRock spot ETH ETF amendment

Ethereum (ETH) suffered a brief decline on Wednesday afternoon despite increased accumulation from whales. This follows Ethereum restaking protocol Renzo restaked ETH (ezETH) crashing from its 1:1 peg with ETH and increased activities surrounding spot Ethereum ETFs.

More Ethereum News

Injective price weakness persists despite over 5.9 million INJ tokens burned

Injective price weakness persists despite over 5.9 million INJ tokens burned

Injective (INJ) price is trading with a bearish bias, stuck in the lower section of the market range. The bearish outlook abounds despite the network's deflationary efforts to pump the price. Coupled with broader market gloom, INJ token’s doomed days may not be over yet.

More Injective News

US intensifies battle against crypto privacy protocols following crackdown on Samourai Wallet

US intensifies battle against crypto privacy protocols following crackdown on Samourai Wallet

CEO Keonne Rodriguez and CTO William Lonergan of Samourai Wallet were arrested by the US Department of Justice (DoJ) on Wednesday and charged with $100 million in money laundering on a count and illegal money transmitting on another count. This move could see privacy-focused cryptocurrencies take a dip.

More Cryptocurrencies News

Near Protocol Price Prediction: NEAR fulfills targets but a 10% correction may be on the horizon

Near Protocol Price Prediction: NEAR fulfills targets but a 10% correction may be on the horizon

Near Protocol price has completed a 55% mean reversal from the bottom of the market range at $4.27. Amid growing bearish activity, NEAR could drop 10% to the $6.00 psychological level before a potential recovery. A break and close above $7.95 would invalidate the downleg thesis.

More Near Protocol News

Bitcoin: BTC post-halving rally could be partially priced in Premium

Bitcoin: BTC post-halving rally could be partially priced in

Bitcoin (BTC) price briefly slipped below the $60,000 level for the last three days, attracting buyers in this area as the fourth BTC halving is due in a few hours. Is the halving priced in for Bitcoin? Or will the pioneer crypto note more gains in the coming days? 

Read full analysis

BTC

ETH

XRP