Ethereum Price Prediction: ETH uptrend to $2,000 in grave danger amid flashing sell signals
- Ethereum recovery hits the barrier at $1,600, cutting short the upswing to $2,000.
- The TD Sequential indicator sell signal on the 4-hour chart adds credence to the bearish picture.
- A spike in network gas fees seems to coincide with Ether's local bottoms and short-term bounce backs.
- Holding above the 50 SMA could secure ETH uptrend and jumpstart the breakout to $2,000.

Ethereum's technical breakout on Monday had a target close to $1,700, but the price recovery failed to overcome the barrier at $1,600. A correction is underway with Ether struggling to hold above $1,500.
Spikes in Ethereum gas fees could indicate short-term pullbacks
Ethereum gas fees is exorbitantly high, but the situation has become a norm. Over the last 30 to 60 days, the fee used to make transactions on the network increased significantly. While the gas averages at $12, there are instances where it swells three to four times.
However, Santiment's data reveals that a spike in the gas fees usually lasts an average of 30 to 60 minutes. What is intriguing is that the upswings in the gas tend to coincide with Ether's local price bottoms and short-term bounce backs.
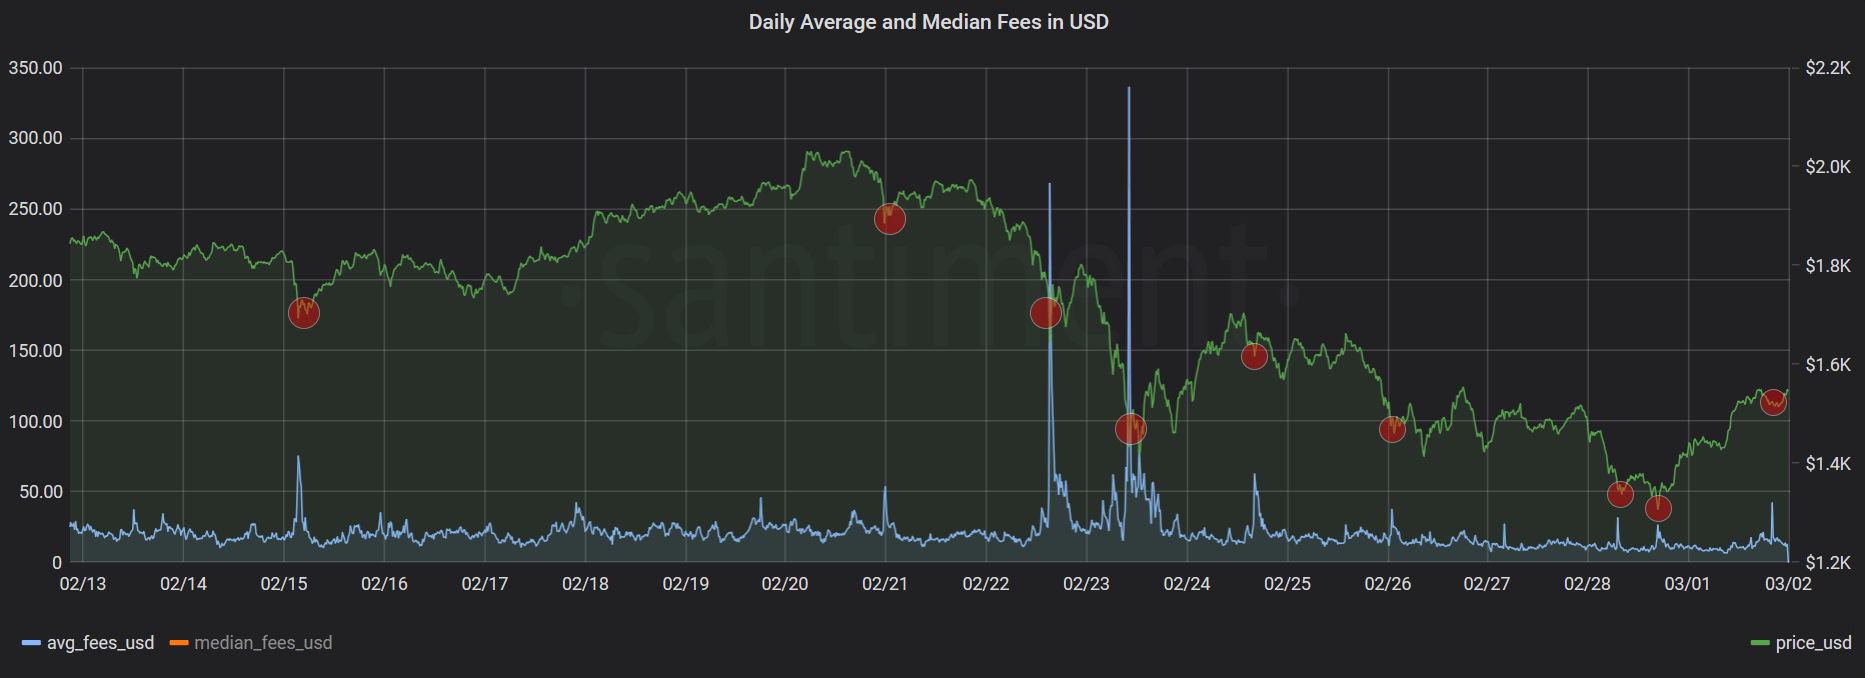
Ethereum average fees (21 days)
Note that this finding is not conclusive but gives an insight into the gas fee spikes, which could be triggered by panic selloffs in conjunction with 'paper hand' capitulation. A buy the dip pressure then results in Ethereum's short-term bottom and a pullback.
Ethereum struggles to sustain the uptrend
Ether is trading at $1,545 and flirting with the 50 Simple Moving Average (SMA). The breakout from the falling wedge pattern suggested that the liftoff will hit levels close to $1,700. Moreover, a step above the 100 Simple Moving Average (SMA) could trigger more buy orders as investors anticipate a return to highs above $2,000.
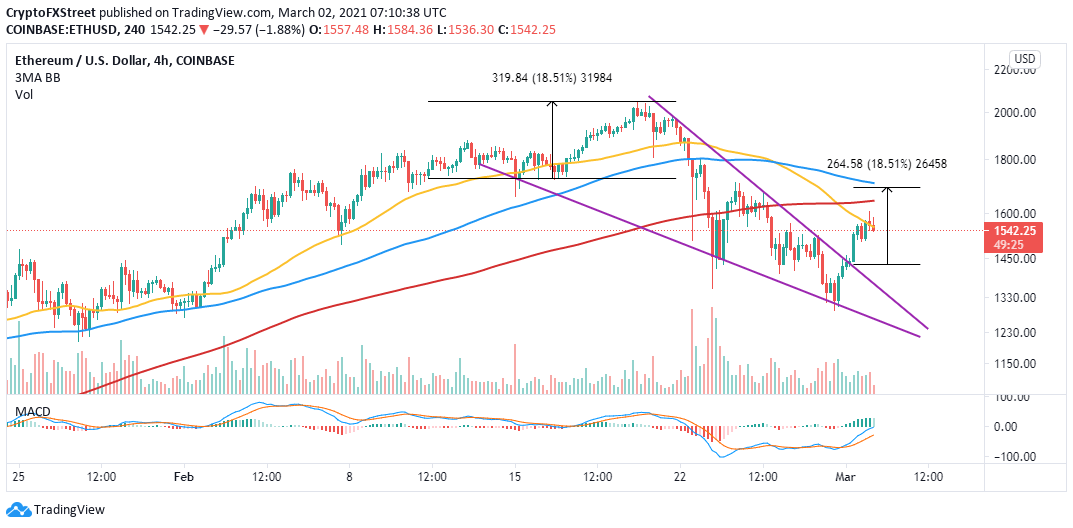
ETH/USD 4-hour chart
Meanwhile, failing to hold above the 50 SMA on the 4-hour chart would be a bearish signal. Panic-selling will increase the overhead pressure, forcing Ethereum to explore downhill levels toward $1,200.
Notably, the TD Sequential indicator has presented a sell signal in the form of a green nine candlestick. The bearish signal comes at a time when the uptrend is in jeopardy. If validated, the pioneer altcoin will fall in one to four 4-hour candlesticks, adding credibility to the bearish narrative.
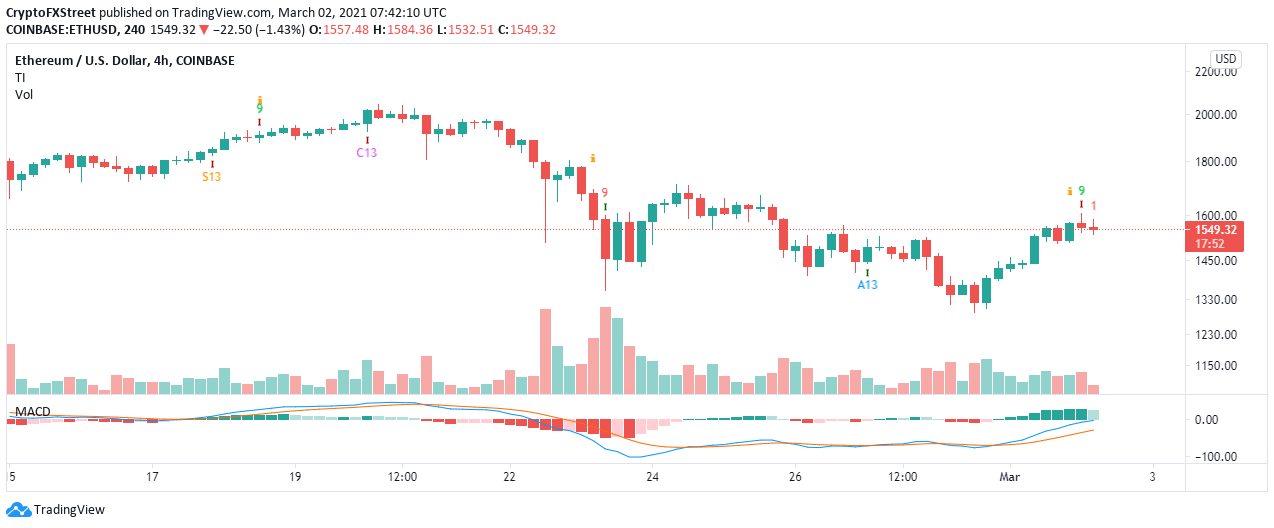
ETH/USD 4-hour chart
Looking at the other side of the fence
The uptrend will be secured if Ethereum manages to hold onto the 50 SMA support on the 4-hour chart. Besides, the falling wedge pattern's impact is still in the picture, and with a small boost, ETH could swing to highs above $1,700. Similarly, the Moving Average Convergence Divergence (MACD) has a bullish impulse, which could keep buyer interest high.
Author

John Isige
FXStreet
John Isige is a seasoned cryptocurrency journalist and markets analyst committed to delivering high-quality, actionable insights tailored to traders, investors, and crypto enthusiasts. He enjoys deep dives into emerging Web3 tren




