- Ethereum price in a tight range with bulls trying to break out above $3,200.
- The risk of fading to the downside is still possible.
- Expect bulls to break out of the range and target $3,391 as an upside target.
Ethereum (ETH) price action is stuck in a range between $2,695 and $3,200 for seven consecutive days. Bulls are trying to push price action further upward with the Relative Strength Index (RSI) and global market sentiment very much in their favor.
The positive global market sentiment backs Ethereum price
Ethereum price has been stuck in a range for seven consecutive days between $2,695 and $3,200. Bulls look to try and push the price to the upside as the monthly S1 support level is holding quite well. Bulls have a few reasons for an entry in long positions in ETH price action. Around $2,700, there is the purple horizontal line that holds historical support from June 15. Around that same level, the monthly S1 support level for September is floating as well. ETH price action has been very responsive to that S1 support level.
ETH price action has an additional element in its corner for a bull run, and that is the RSI, which is just below 50, making it in an oversold area. This is a queue for bulls to start buying into Ethereum price action, as the RSI will begin to shift to the upside with prices ready for a breakout. Next to that, global market sentiment favors the upside and could start an uptrend as global markets are back in a risk-on setup.
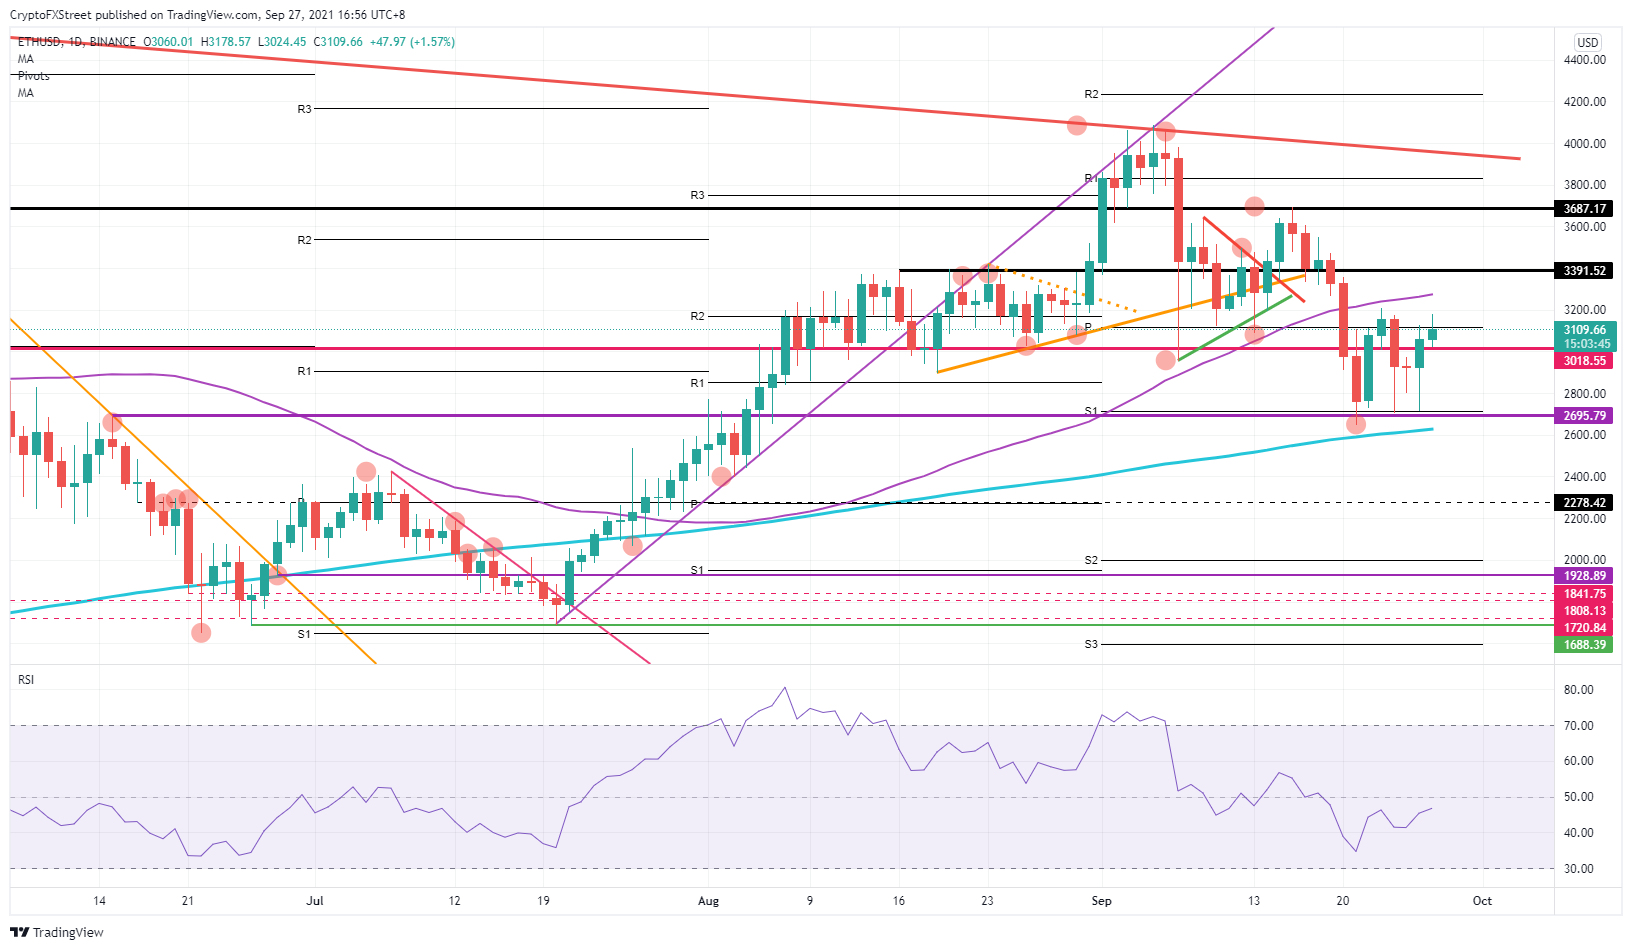
ETH/USD daily chart
Ethereum price will target $3,391 as the first point for some profit-taking with some short-term historical importance at this level. Bear in mind that this level has been chopped up quite a lot this month, so it will not be that well respected. But it could spread out profit-taking even toward $3,687.
Should the bears in ETH price action be able to push buyers out of their positions, helped by a shift in market sentiment for example, expect a run back to the lower leg of the range trade at $2,695. As the 55-day Simple Moving Average (SMA) is hovering just below there, expect sellers to face quite some headwind from this technical support that will likely limit further downside in the short-term.
Like this article? Help us with some feedback by answering this survey:
Information on these pages contains forward-looking statements that involve risks and uncertainties. Markets and instruments profiled on this page are for informational purposes only and should not in any way come across as a recommendation to buy or sell in these assets. You should do your own thorough research before making any investment decisions. FXStreet does not in any way guarantee that this information is free from mistakes, errors, or material misstatements. It also does not guarantee that this information is of a timely nature. Investing in Open Markets involves a great deal of risk, including the loss of all or a portion of your investment, as well as emotional distress. All risks, losses and costs associated with investing, including total loss of principal, are your responsibility. The views and opinions expressed in this article are those of the authors and do not necessarily reflect the official policy or position of FXStreet nor its advertisers. The author will not be held responsible for information that is found at the end of links posted on this page.
If not otherwise explicitly mentioned in the body of the article, at the time of writing, the author has no position in any stock mentioned in this article and no business relationship with any company mentioned. The author has not received compensation for writing this article, other than from FXStreet.
FXStreet and the author do not provide personalized recommendations. The author makes no representations as to the accuracy, completeness, or suitability of this information. FXStreet and the author will not be liable for any errors, omissions or any losses, injuries or damages arising from this information and its display or use. Errors and omissions excepted.
The author and FXStreet are not registered investment advisors and nothing in this article is intended to be investment advice.
Recommended Content
Editors’ Picks
Ripple's move above this key level could trigger nearly 50% rally for XRP
Ripple has overcome a critical resistance level and flipped into a support floor on the weekly time frame. This development happened while XRP tightly consolidated for roughly 250 days. Investors can expect XRP to kickstart a massive rally.
Optimism price outlook with nearly $90 million worth of OP tokens flooding markets on Friday
Optimism volatility has shrunk in the ours leading to the network’s cliff unlock. It joins the likes of dYdX and Sui, which have similar events on their calendars. As token unlocks are often considered bearish catalysts, investors should brace for a reaction after the event.
Top 3 Price Prediction Bitcoin, Ethereum, Ripple: Retail watches from the sidelines with a bias for shorts
Bitcoin could clear $73,777 peak as BTC bulls resurface. Ethereum might fall 10% before next leg up as ETH RSI teases with sell signal. XRP could lose $0.6000 threshold as Ripple bulls fail to show up.
Jito price could hit $6 as JTO coils up inside this bullish pattern
Jito price action shows a potential cup and handle formation. Based on theoretical measurement rules, a successful breakout could yield a 56% rally to $6.0. A breakdown of the $3.86 support level would create a lower low for JTO and invalidate the bullish thesis.
Bitcoin: BTC may have recovered, but is it out of the woods?
Bitcoin’s (BTC) upward momentum has shown a significant decline for the past two weeks or so. This development led to a bearish signal on the weekly and an uncertain outlook on the monthly.