Ethereum Price Prediction: ETH prepares for dip to $2,800
- Ethereum price is facing indecision after making a nearly 100% gain from the recent rally.
- ETH is consolidating, moving sideways and facing the risk of a 6% dip.
- Only a break above the enormous hurdle would have Ethereum price revive its uptrend.

Ethereum price is retracing from following its explosive rally that witnessed ETH surge by over 95% from the July 20 low. The second-largest cryptocurrency by market capitalization is now consolidating as volume gradually subsides.
Ethereum price faces mighty resistance
Ethereum price has broken below the governing ascending parallel channel pattern that commenced on August 7, which previously suggested a bullish outlook. It appears that since ETH has sliced below the lower boundary of the chart pattern at $3,096, the bullish outlook has been voided for now.
The Momentum Reversal Indicator (MRI) has flashed a third consecutive top signal on the August 16 daily candle, warning that Ethereum price was headed for a trend reversal.
The recent plunge also pushed Ethereum price lower under the 50% Fibonacci extension level at $3,037. The indecision shown by the series of doji candles on the 12-hour chart suggests that ETH may continue to move sideways as there is a general equilibrium between buyers and sellers.
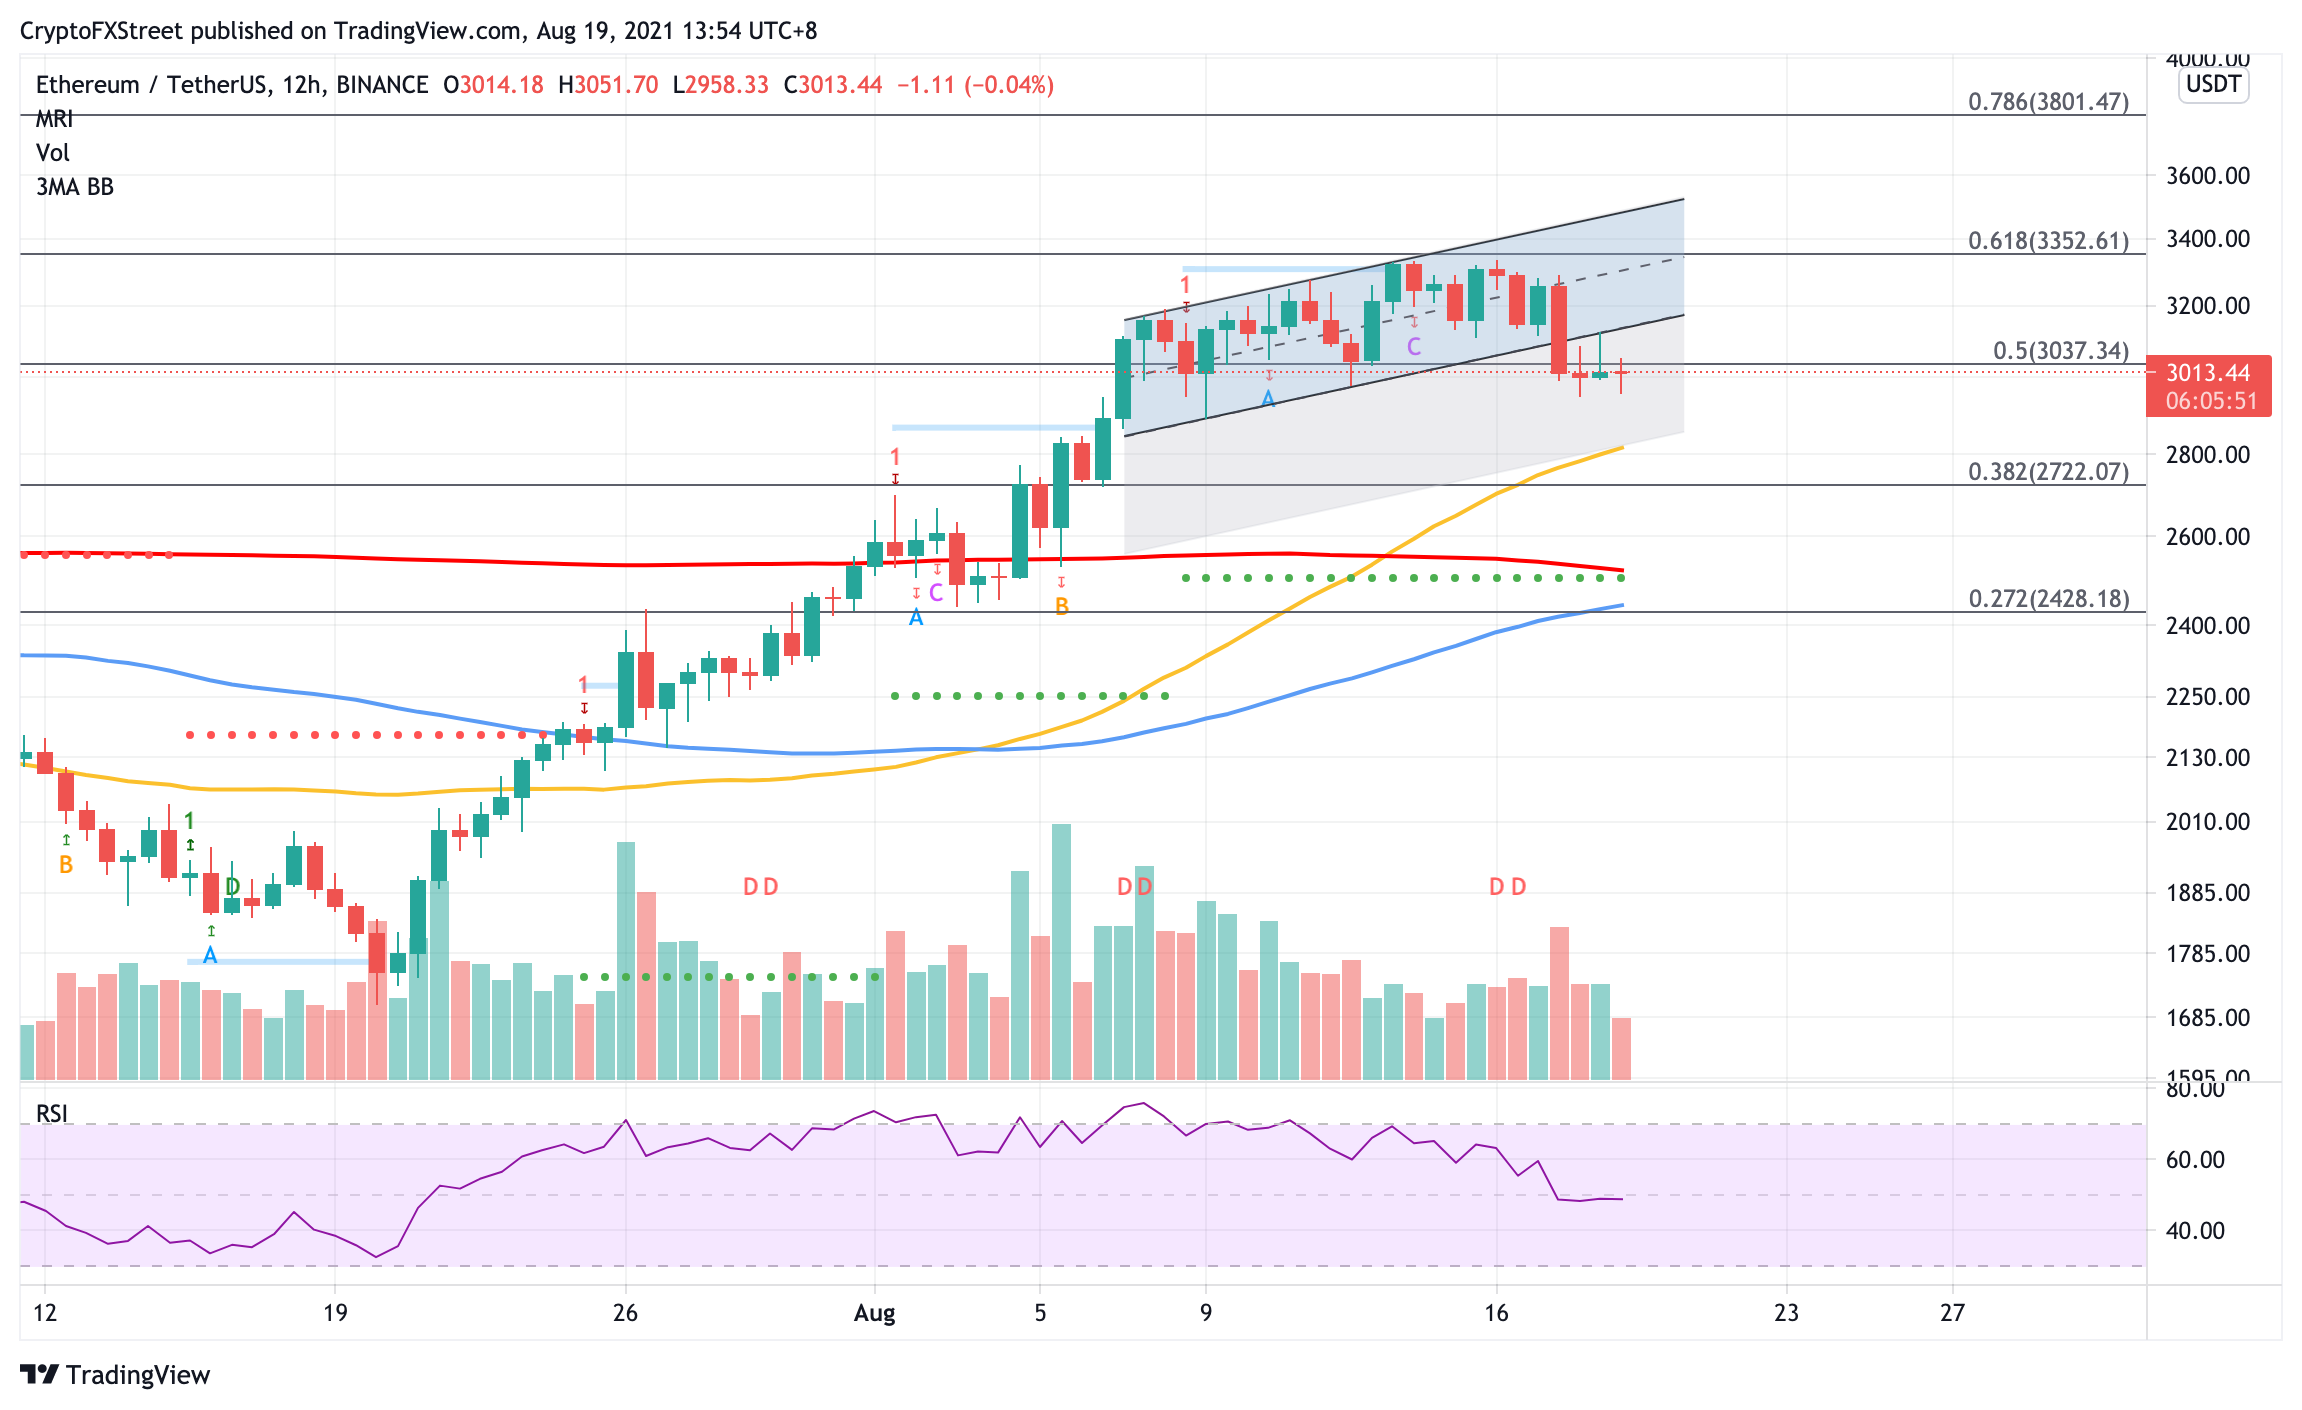
ETH/USDT 12-hour chart
Should selling pressure witness a spike, Ethereum price could fall further, reaching the bearish target given by the governing technical pattern, tagging the downside trend line of the lower parallel channel at $2,819 that coincides with the 50 twelve-hour Simple Moving Average (SMA).
If the bears continue to take control, Ethereum price may test the reliability of the 38.2% Fibonacci extension level at $2,722 as support.
On the upside, Ethereum price is faced with a stiff hurdle at the 50% Fibonacci extension level at $3,037. The three previous candles closed below this level consecutively, suggesting that this level could be a tough obstacle for ETH.
IntoTheBlock’s In/Out of the Money Around Price (IOMAP) data shows that over 480,000 addresses that purchased over 8 million ETH at an average price of $3,039 are underwater at the current price.
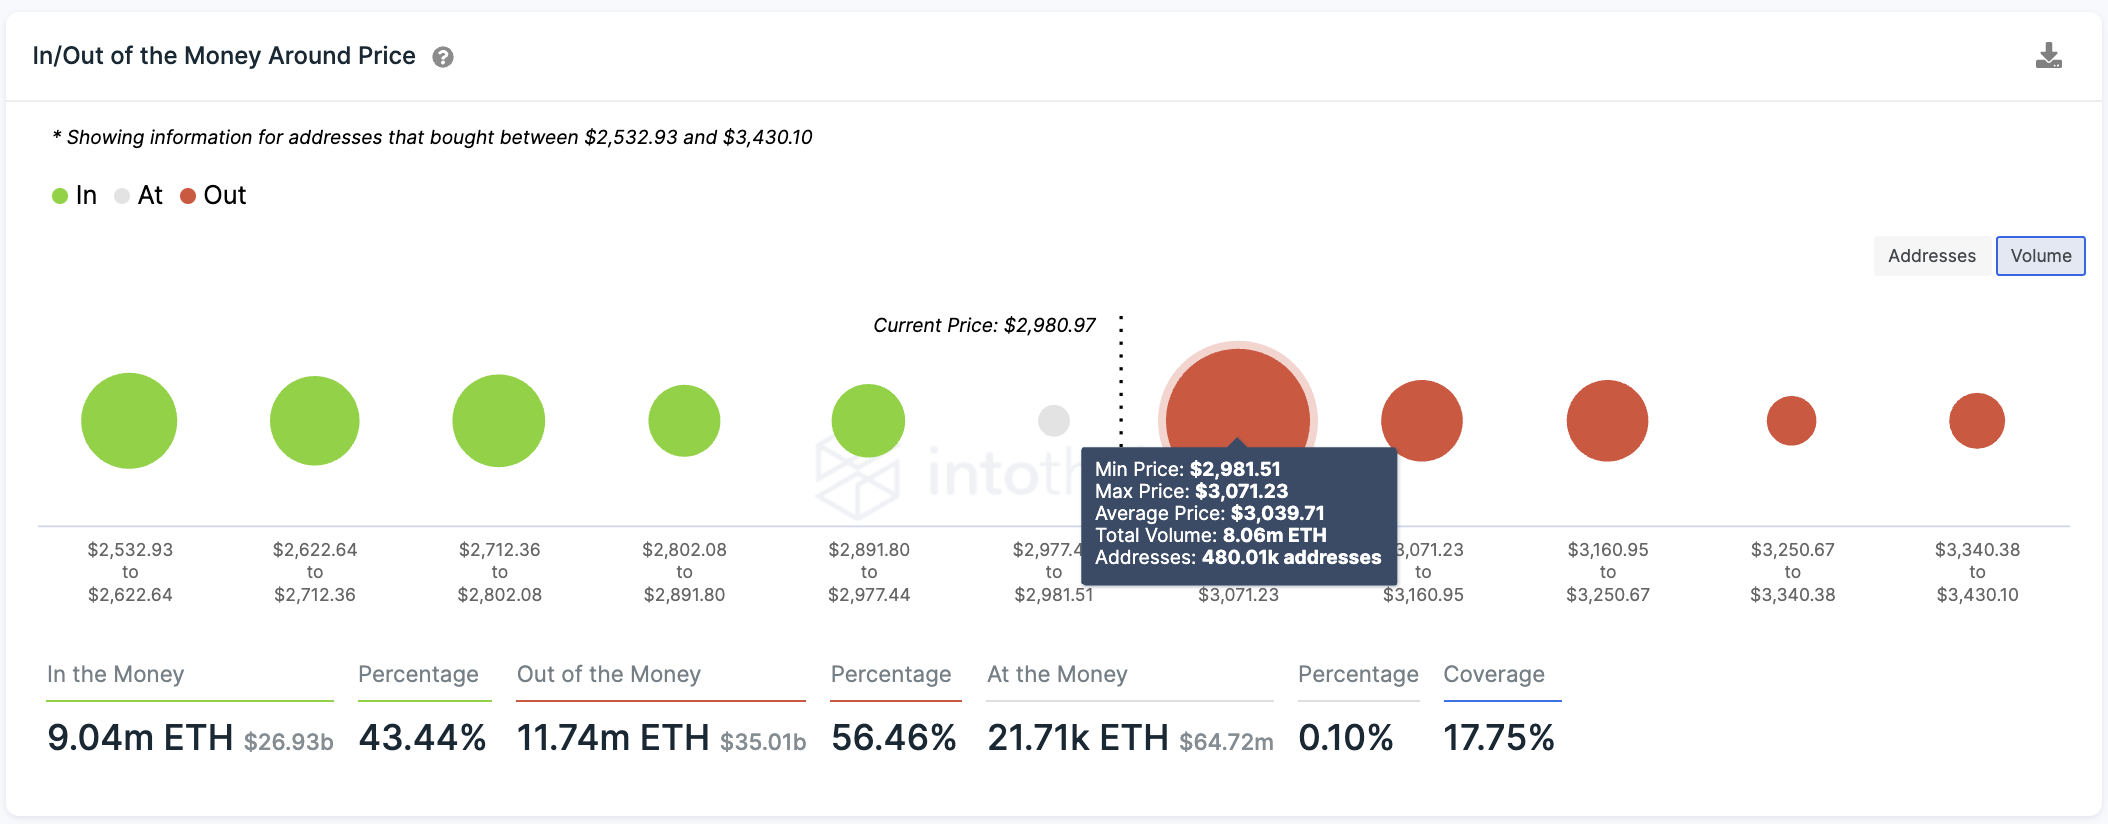
ETH IOMAP
Only a break above this area could void the bearish outlook and open up the possibility of a revival of the Ethereum price rally.
There are still a few key levels to tackle for ETH if it is able to break free from the current pullback.
Above the 50% Fibonacci extension level is the lower boundary of the parallel channel at $3,135. Should Ethereum price be able to conquer this level, ETH is more likely to continue printing higher highs and eventually attempt to surpass its all-time high.
Author

Sarah Tran
Independent Analyst
Sarah has closely followed the growth of blockchain technology and its adoption since 2016.


