Ethereum kick-starts new deflationary era as ETH price looks to retest $4,000
- Ethereum price holds steady above the $3,000 psychological level, as it eyes higher highs.
- ETH worth $183 million was burned after the London hard fork ushered in a new era of deflation.
- On-chain metrics show little-to-no resistance levels, hinting at a bullish outlook for the altcoin.

Ethereum price is currently experiencing a pullback after attempting to rally through a thicket of resistance barriers. However, the retracement seems to be holding above a crucial support barrier, which is a bullish sign.
London hard fork brings in deflation to ETH ecosystem
On August 5, the much-anticipated London hard fork was implemented, and with it the Ethereum Improvement Proposal (EIP)-1559, which reconfigured how fees are structured. The main aim of the proposal was to split the fees into two parts. A portion of it gets tipped to the miners, and some of it gets burned.
This controversial change seems to have borne fruit as roughly 59,731 ETH, currently worth $183 million, has been wiped out of existence. The development effectively reduces ETH supply above ground, making it deflationary.
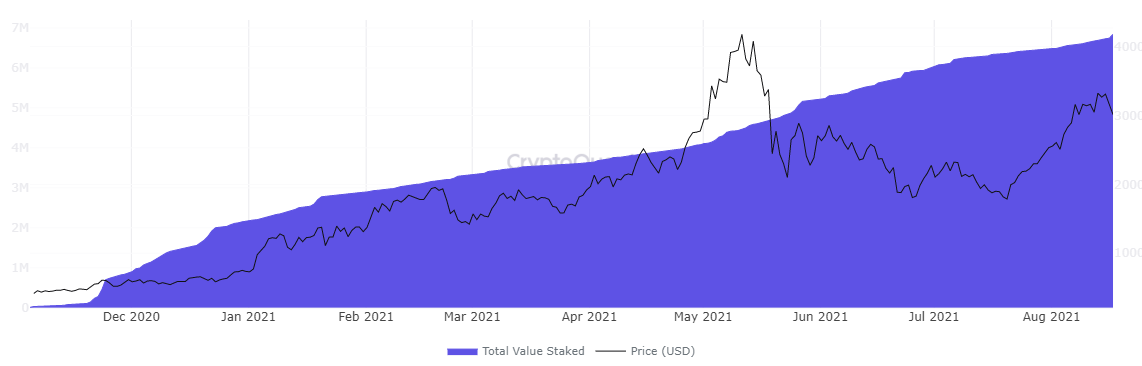
On a similar note, the ETH 2.0 contract address is now the single largest holder of ETH with a balance of 6.73 million ETH.
ETH 2.0 contract addresses chart
While more of the deflation and ETH 2.0 effect will be felt in the coming days, Ethereum co-founder Vitalik Buterin explained how the “governance model” that is so widely seen across the DeFi landscape is apparently holding it back. The models in question utilize coins to vote, and according to Buterin, they face two problems,
(i) inequalities and incentive misalignments even in the absence of attackers, and (ii) outright attacks through various forms of (often obfuscated) vote buying.
He further explains how one could solve this problem by moving away from it.
The most important thing that can be done today is moving away from the idea that coin voting is the only legitimate form of governance decentralization.
While Buterin pens his forward-thinking thoughts, Ethereum miners seem to have found a loophole that helps them increase the output from Nvidia’s LHR graphics card. The graphics card manufacturer set a 50% hash rate limit on its RTX 30 series to prevent Ethereum miners from hogging all the supply from the market back in June.
After accidentally leaking the algorithm to revert their software update, Nvidia made some hardware changes to their newly manufactured cards, but NB miner software seems to have done the impossible and raised the hash rate limit from 50% to 68%.
Ethereum price holds steady above $3,000
Ethereum price rallied 36% from August 3 to August 16 and set up a swing high at $3,335. Since then, ETH has collapsed roughly 11% to where it currently stands, $3,040. It is an optimistic sign that the bulls have managed to hold their ground and keep ETH above the $3,000 psychological level.
Investors can expect a resurgence of buyers around this point, which pushes ETH to rally through the supply zone extending from $3,201 to $3,559. A decisive 12-hour candlestick close above $3,559 will confirm the start of a new leg-up.
This move will open the path to the subsequent barriers at $3,716 and $4,071. Assuming ETH retests $4,000, it would constitute a 34% upswing from the current position.
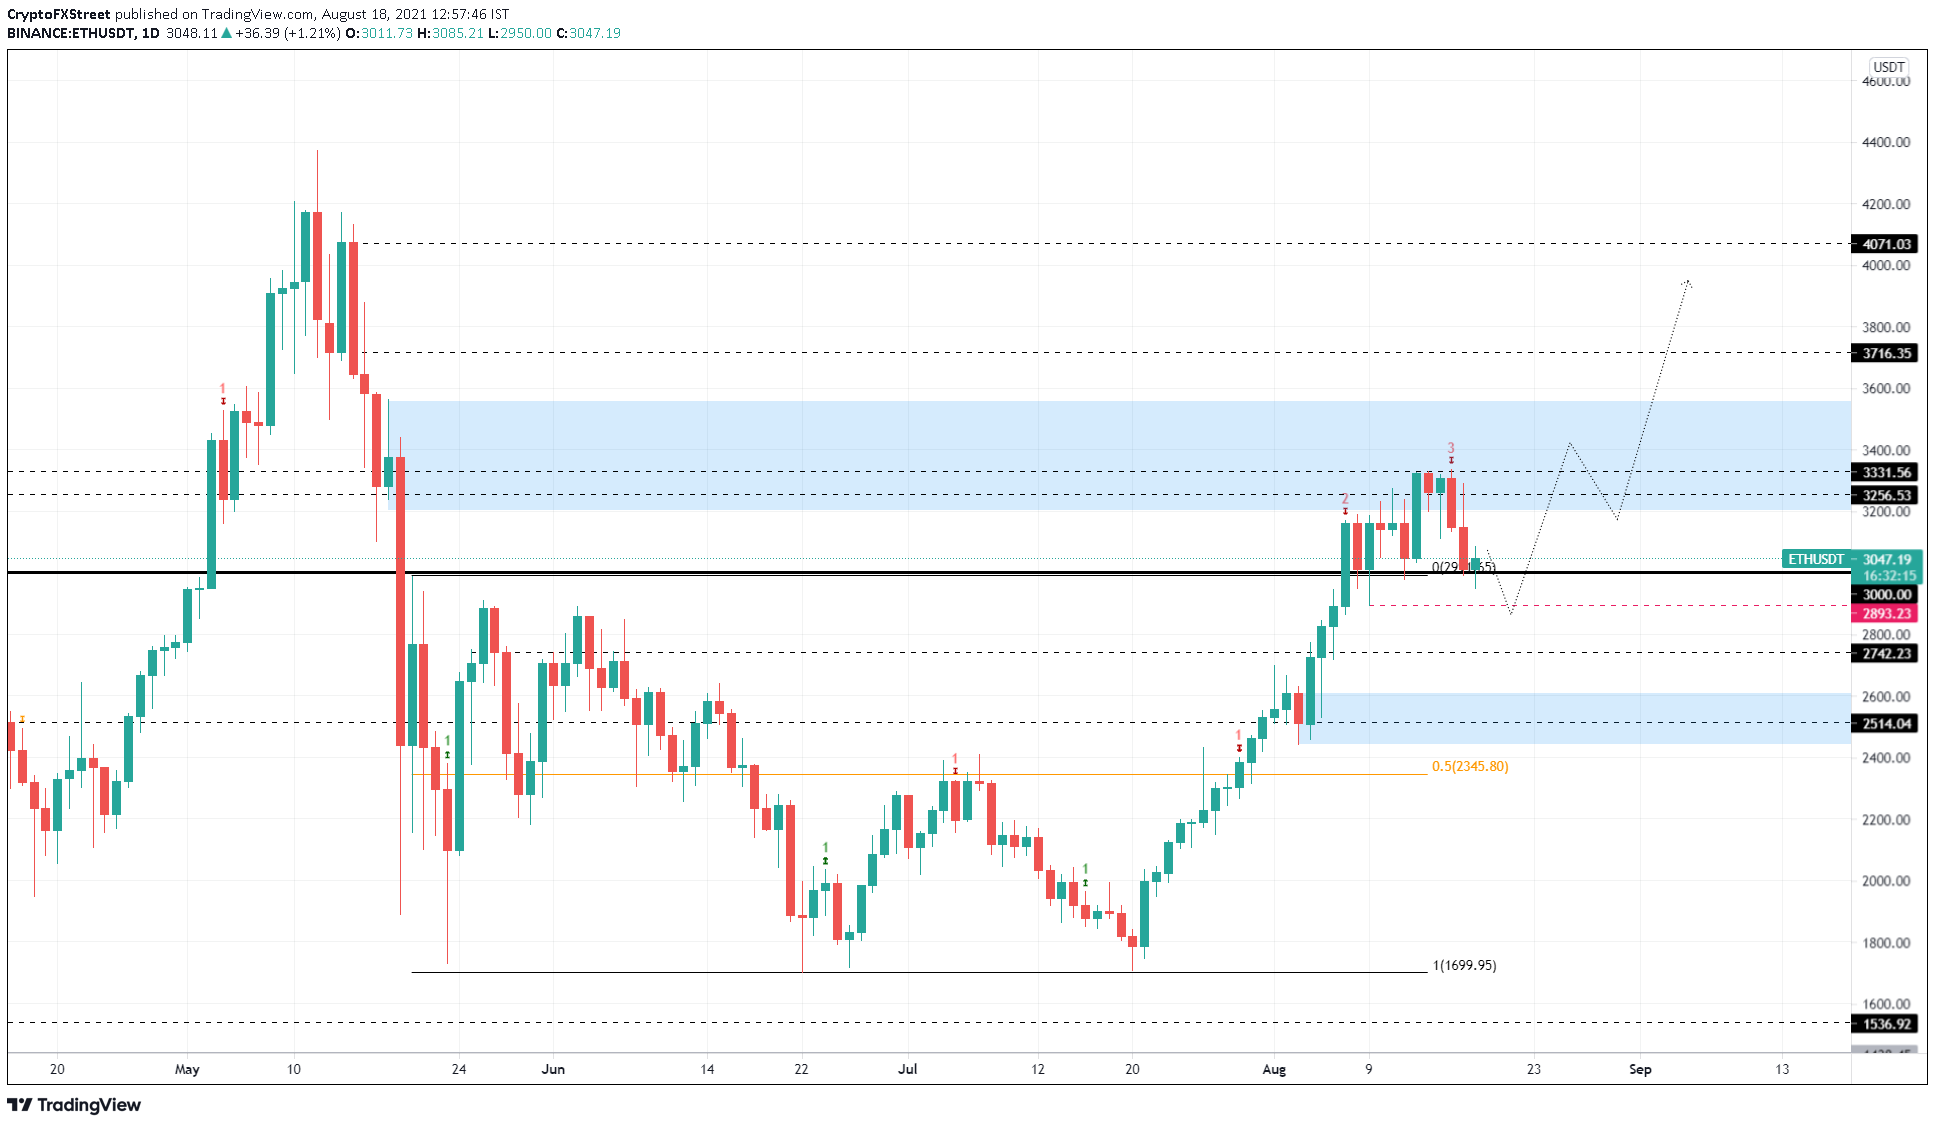
ETH/USDT 12-hour chart
Supporting this thesis is IntoTheBlock’s Global In/Out of the Money (GIOM) model, which shows little-to-no resistance ahead for Ethereum price. Roughly 1.86 million addresses that purchased 3.37 million ETH at an average price of $3,684 are underwater. Therefore, the upswing must overcome the selling pressure from these investors who might want to break even.
However, comparing the “Out of the Money” cluster to the “In the Money” shows how small a threat it poses. Hence, market participants can expect this barrier to be overcome after a minor spike in bullish momentum.
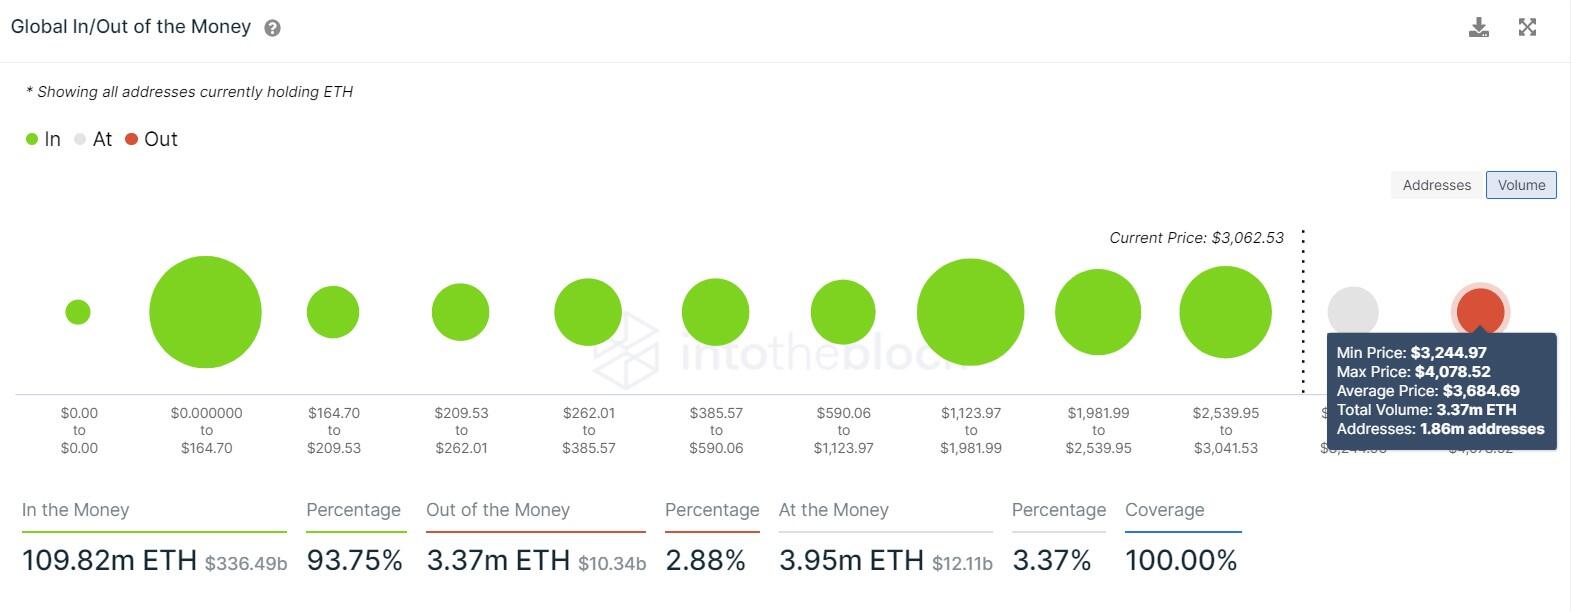
ETH GIOM chart
Adding credence to this outlook is the exchange reserve metric, which shows a reduction from 19.89 million ETH on July 22 to 19.25 on August 17. This 3.2% decline suggests that long-term holders are optimistic about Ethereum price performance, which explains their decision to move their holdings off centralized entities.
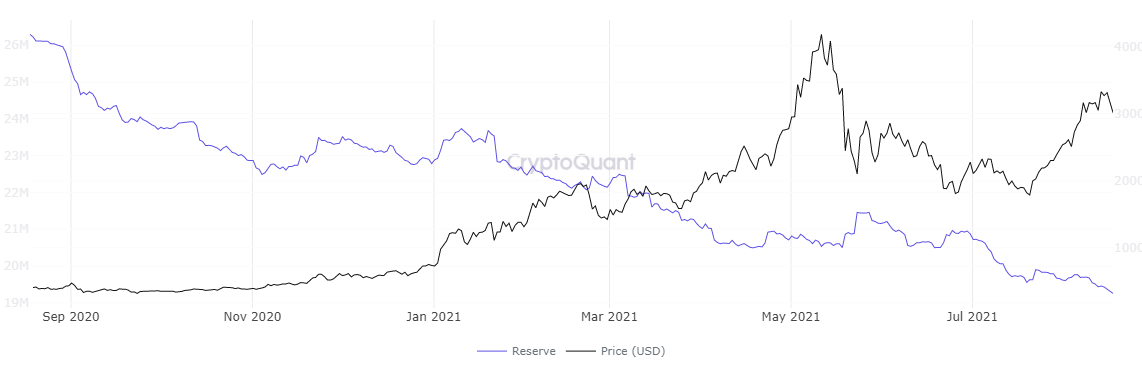
ETH exchange reserve chart
Lastly, the 30-day Market Value to Realized Value (MVRV) model has dropped to 11%, indicating that a significant portion of the profitable investors have sold their holdings.
This fundamental index measures the average profit/loss of market participants that purchased ETH over the past month.
Therefore, the recent decline reveals that the short-term threat of a spike in selling pressure has subsided, paving the way for bulls to restart a new upswing.
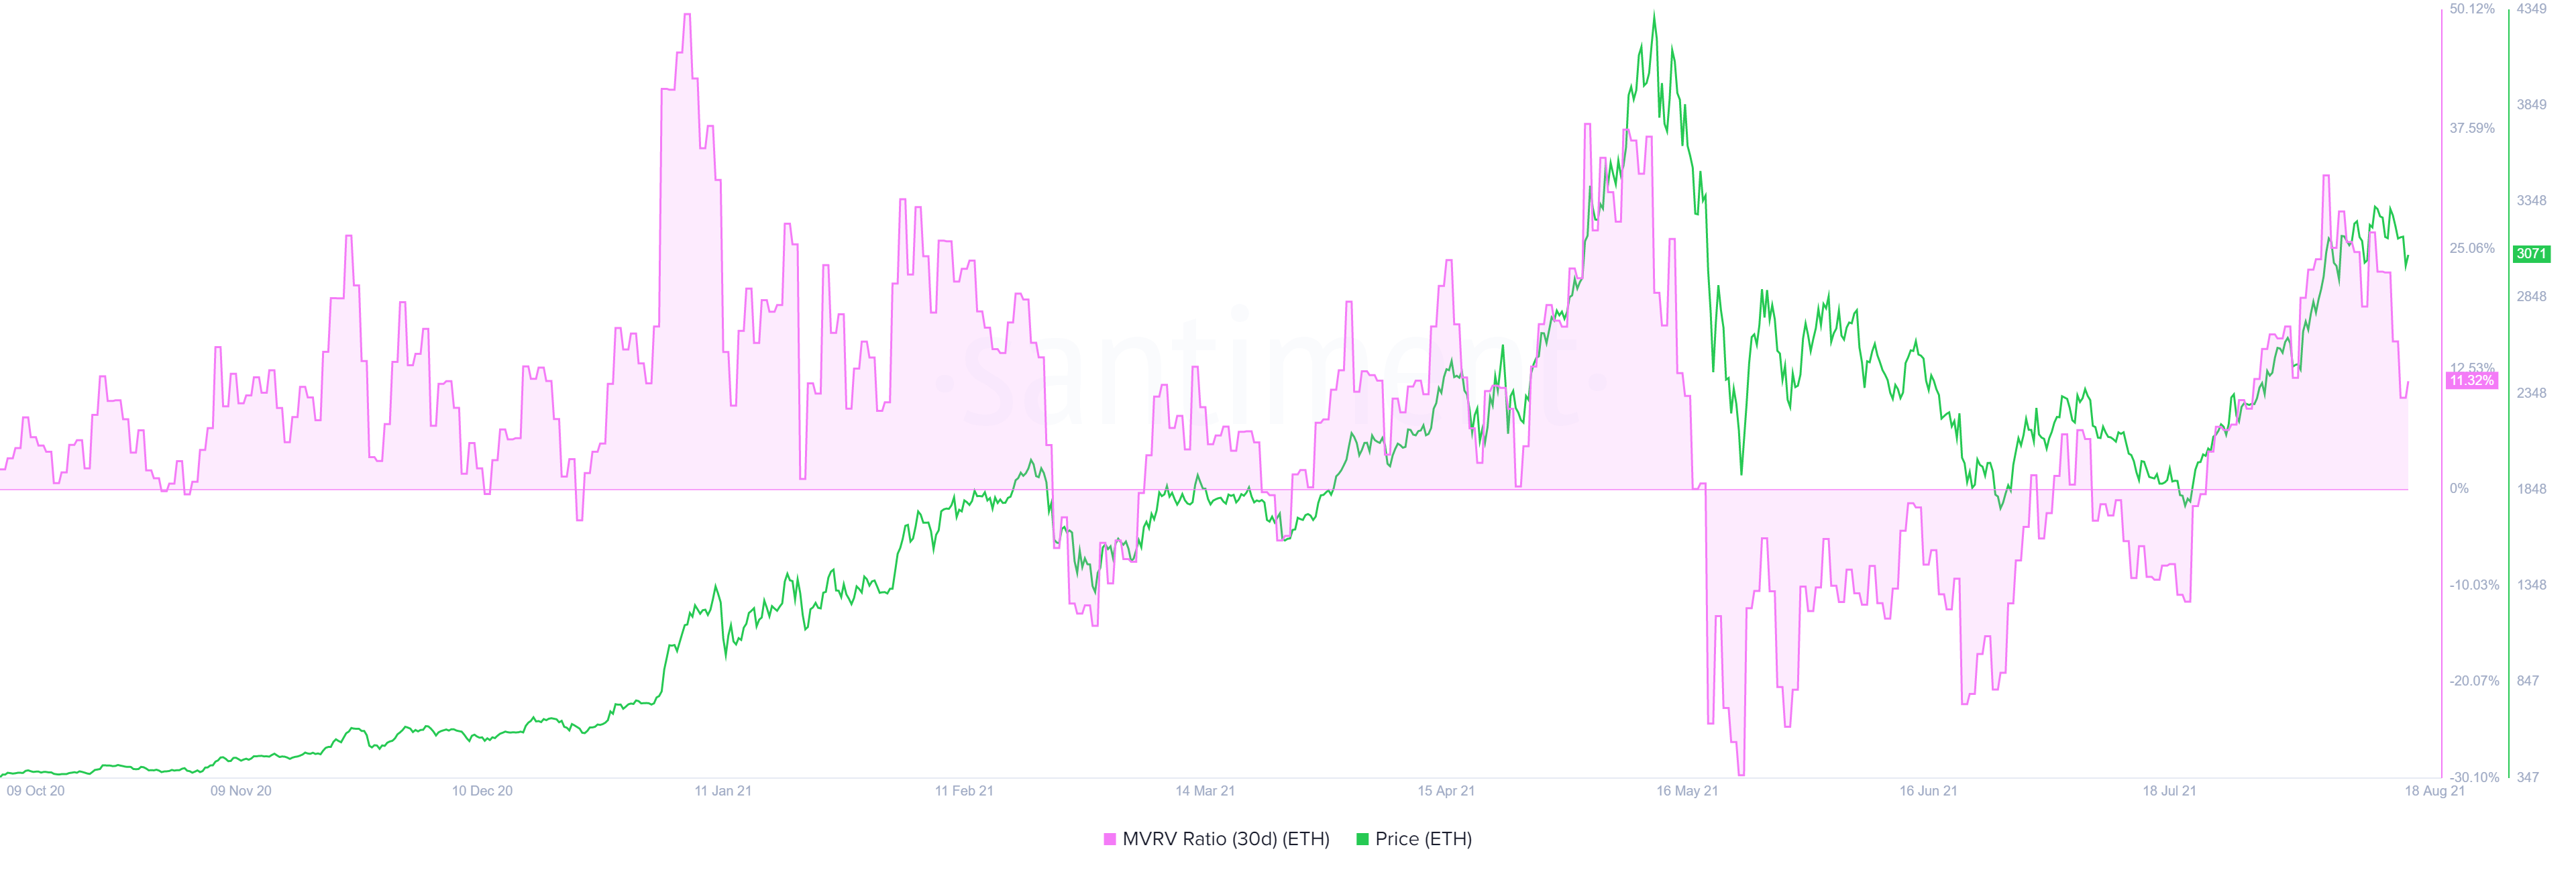
ETH MVRV 30-day chart
While everything seems to be favoring the bulls, things will quickly go south if Ethereum price fails to hold above the $3,000 psychological level. A decisive 12-hour candlestick close below the said barrier will shake the confidence among investors and could lead to a panic selling frenzy.
If the bears breach the $2,893 demand level, it will invalidate the bullish thesis and open the path for a downswing to $2,514.
Author

Akash Girimath
FXStreet
Akash Girimath is a Mechanical Engineer interested in the chaos of the financial markets. Trying to make sense of this convoluted yet fascinating space, he switched his engineering job to become a crypto reporter and analyst.


