Ethereum Price Prediction: ETH grand rally towards $800 seems to be imminent
- ETH is currently trading at $417 after a massive 13% jump in the past 48 hours.
- It seems that the digital asset has formed a double bottom on the 3-day chart.

Ethereum finally had its own breakout after Bitcoin, and it's now trading at $417, well above the previous resistance level at $387. The total market capitalization of ETH has increased by over 6$ billion in the past seven days.
Ethereum prepares for a jump to $800 according to indicators
On the 3-day chart, we can observe what seems to be a potential double bottom formed at around $320 on September 6 and September 21. This powerful bullish reversal pattern has the potential to push Ethereum well beyond the 2020-high at $488.
ETH/USD 3-day chart
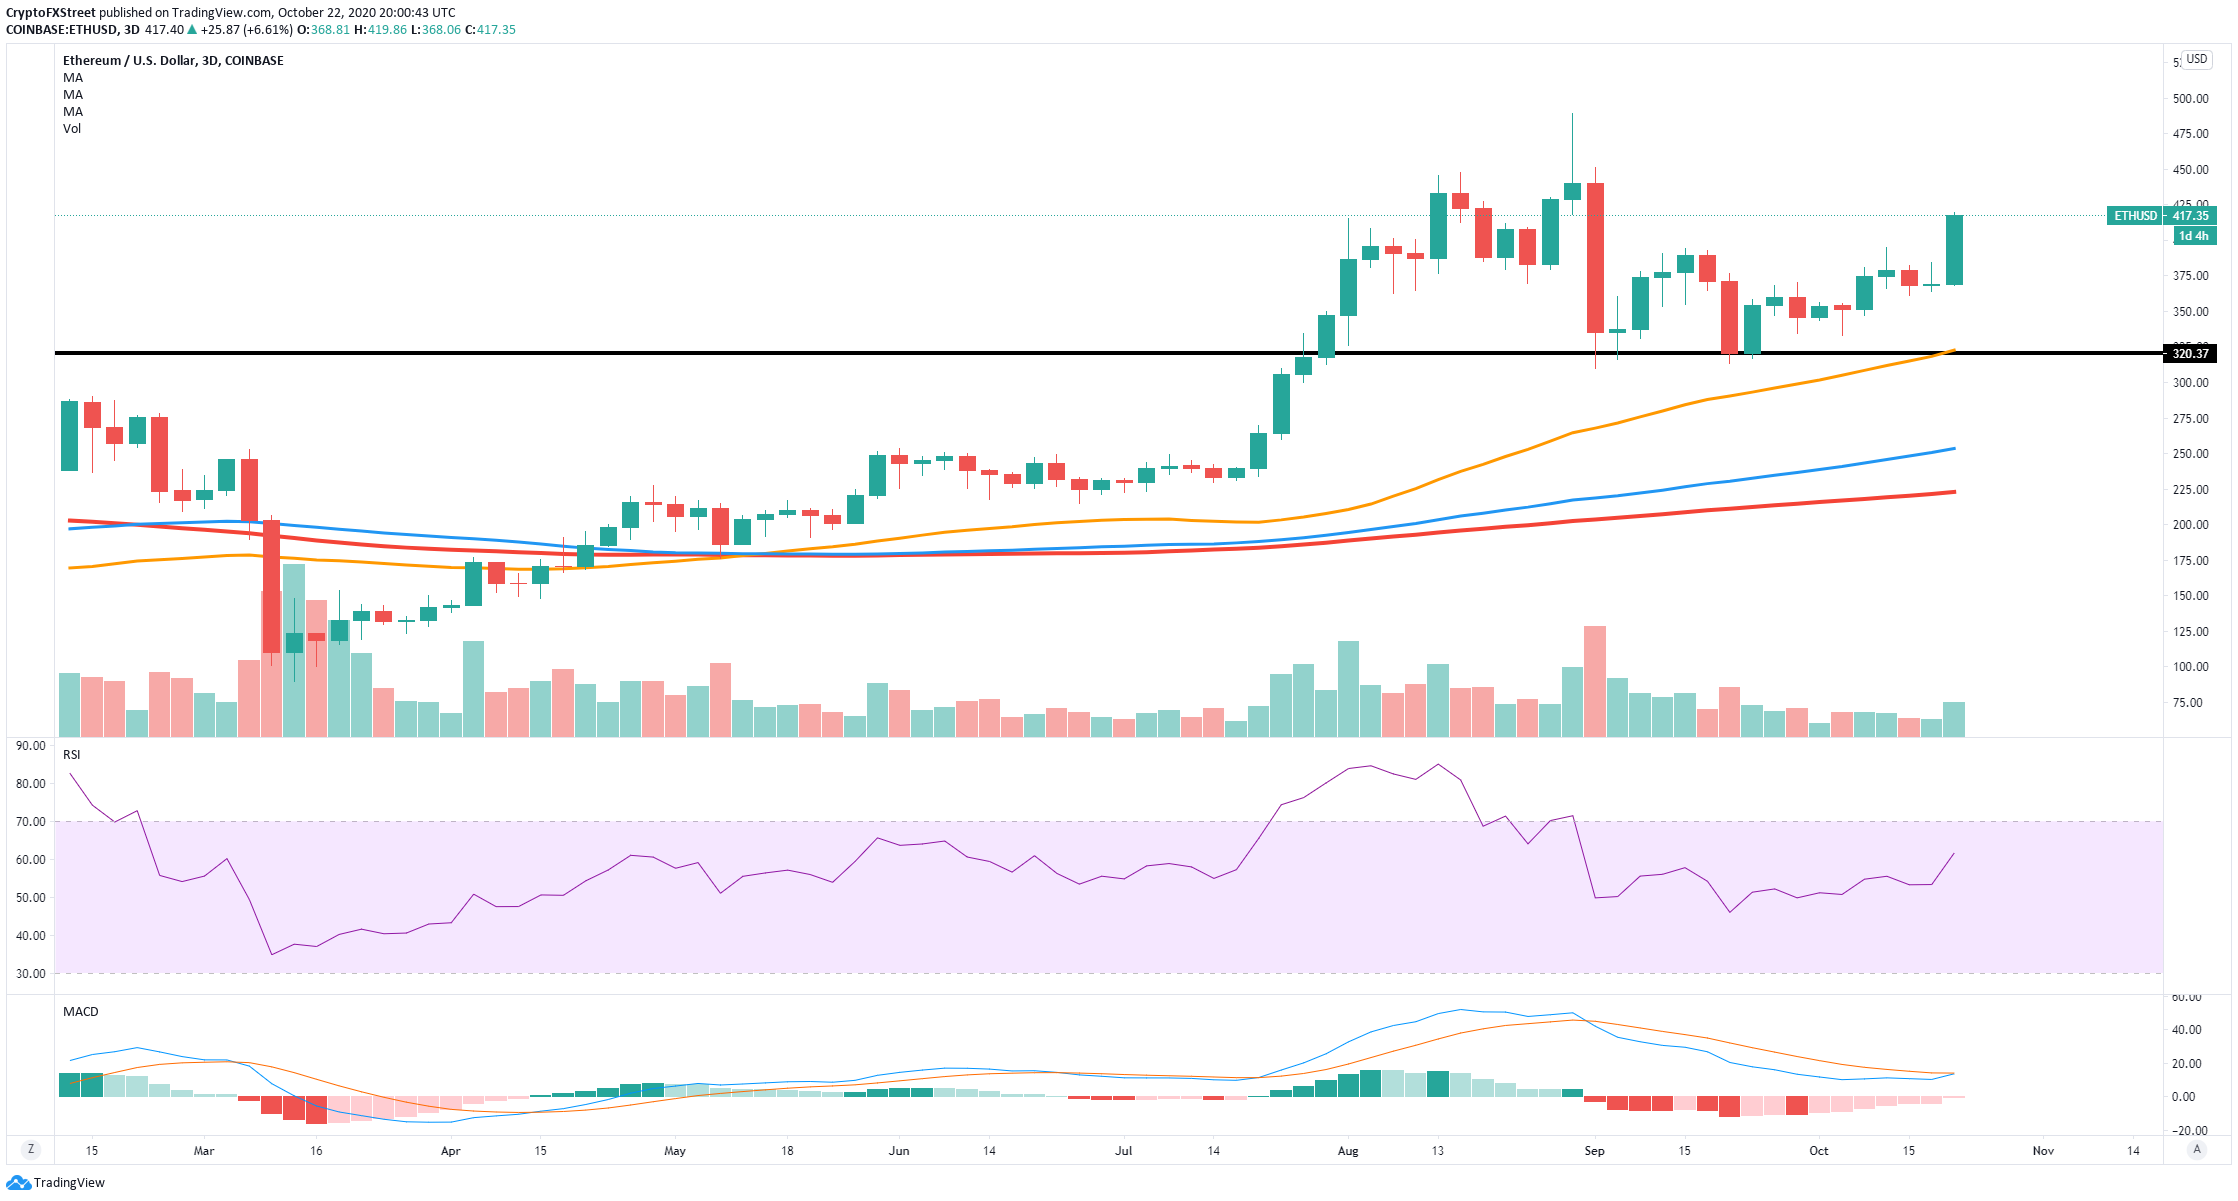
On top of that, the MACD is on the verge of turning bullish for the first time since July 20, which pushed ETH's price by 86% within the next two months. The price is well above the three SMAs acting as support levels, and bulls face very little resistance.
ETH IOMAP Chart
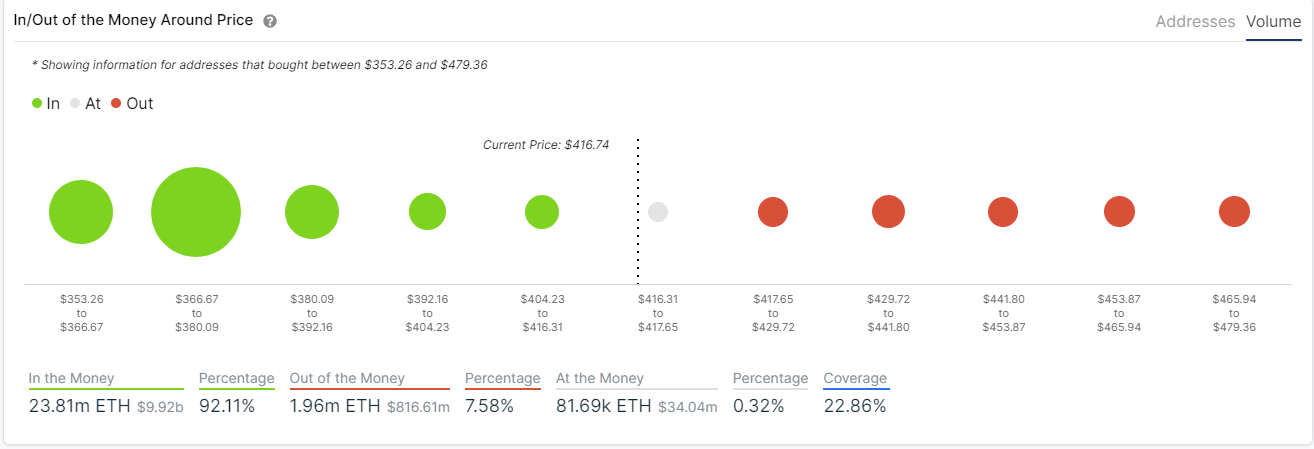
The bullish theory can be further confirmed using the In/Out of the Money Around Price chart, which shows almost no resistance towards $479 compared to the support below. Additionally, the weekly chart remains in favor of the bulls.
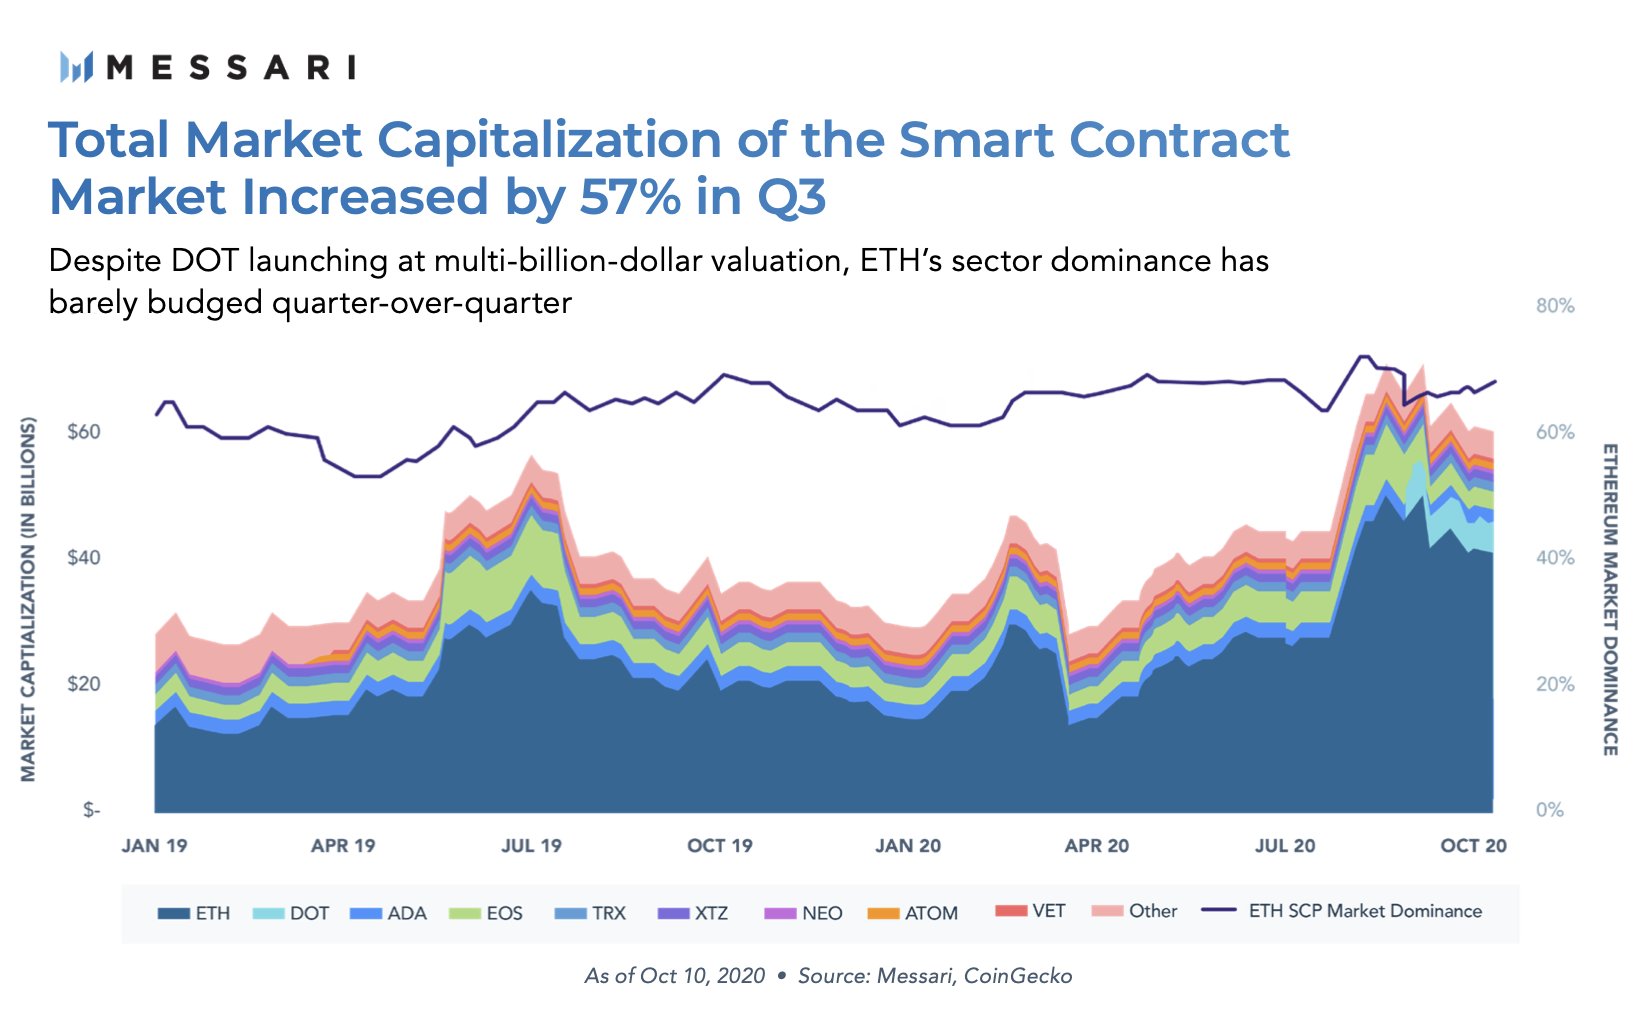
This 2020 has been notably positive for Ethereum thanks to the rise of the DeFi market. According to statistics from Messari, the smart-contracts giant remained as the leader in total market capitalization in Q3 despite PolkaDOT launching with a multi-billion dollar market cap.
ETH/USD weekly chart
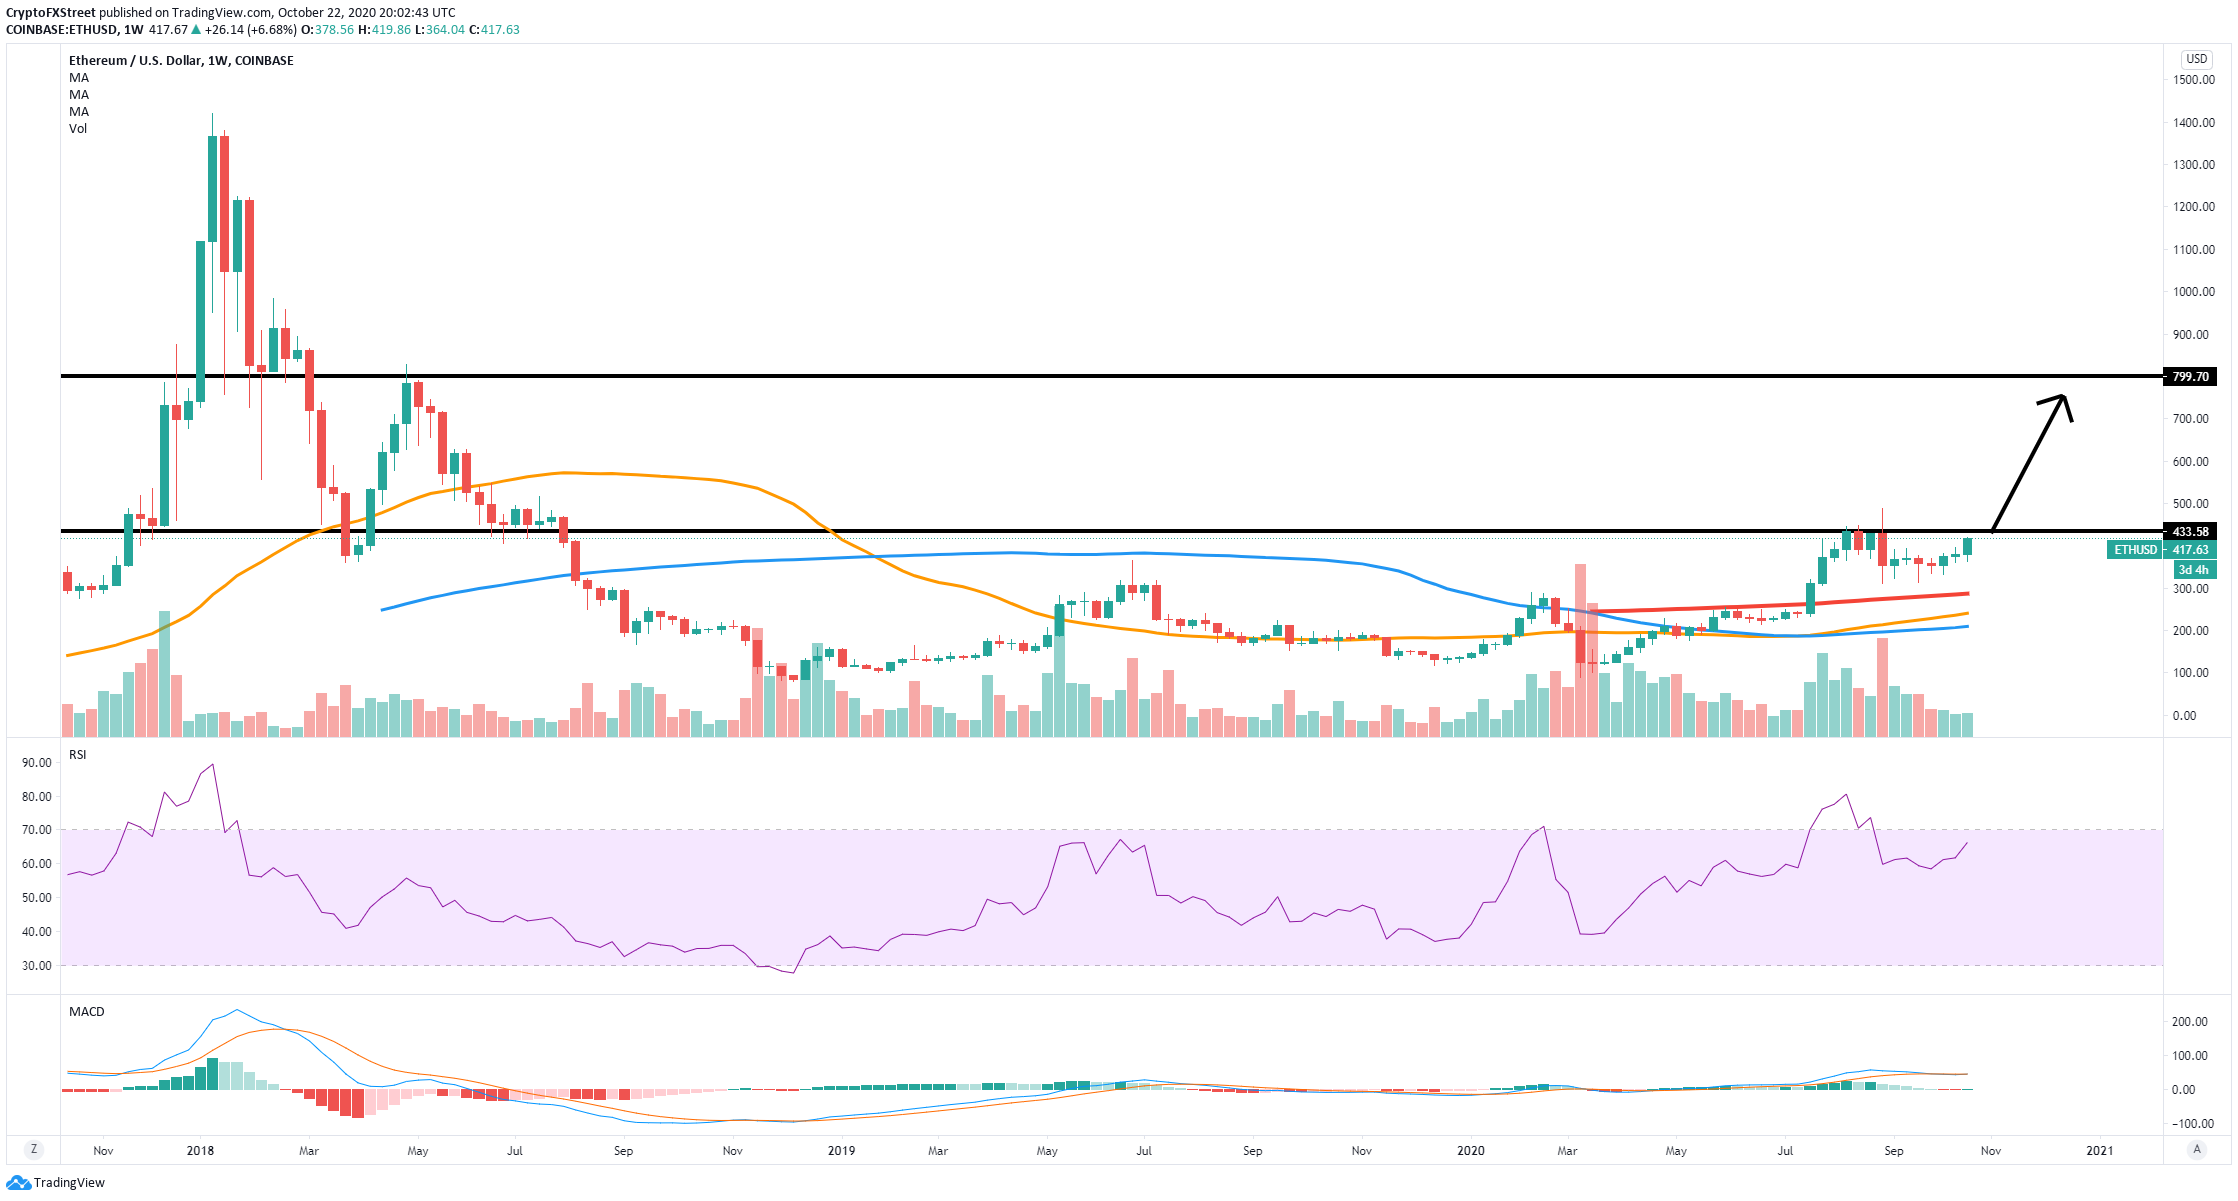
The next point to crack is located at $433, a breakout above this level will push Ethereum to the following price target at $800. The MACD will also turn bullish again by the end of the week thanks to the renewed bullish sentiment.
ETH/USD 4-hour chart
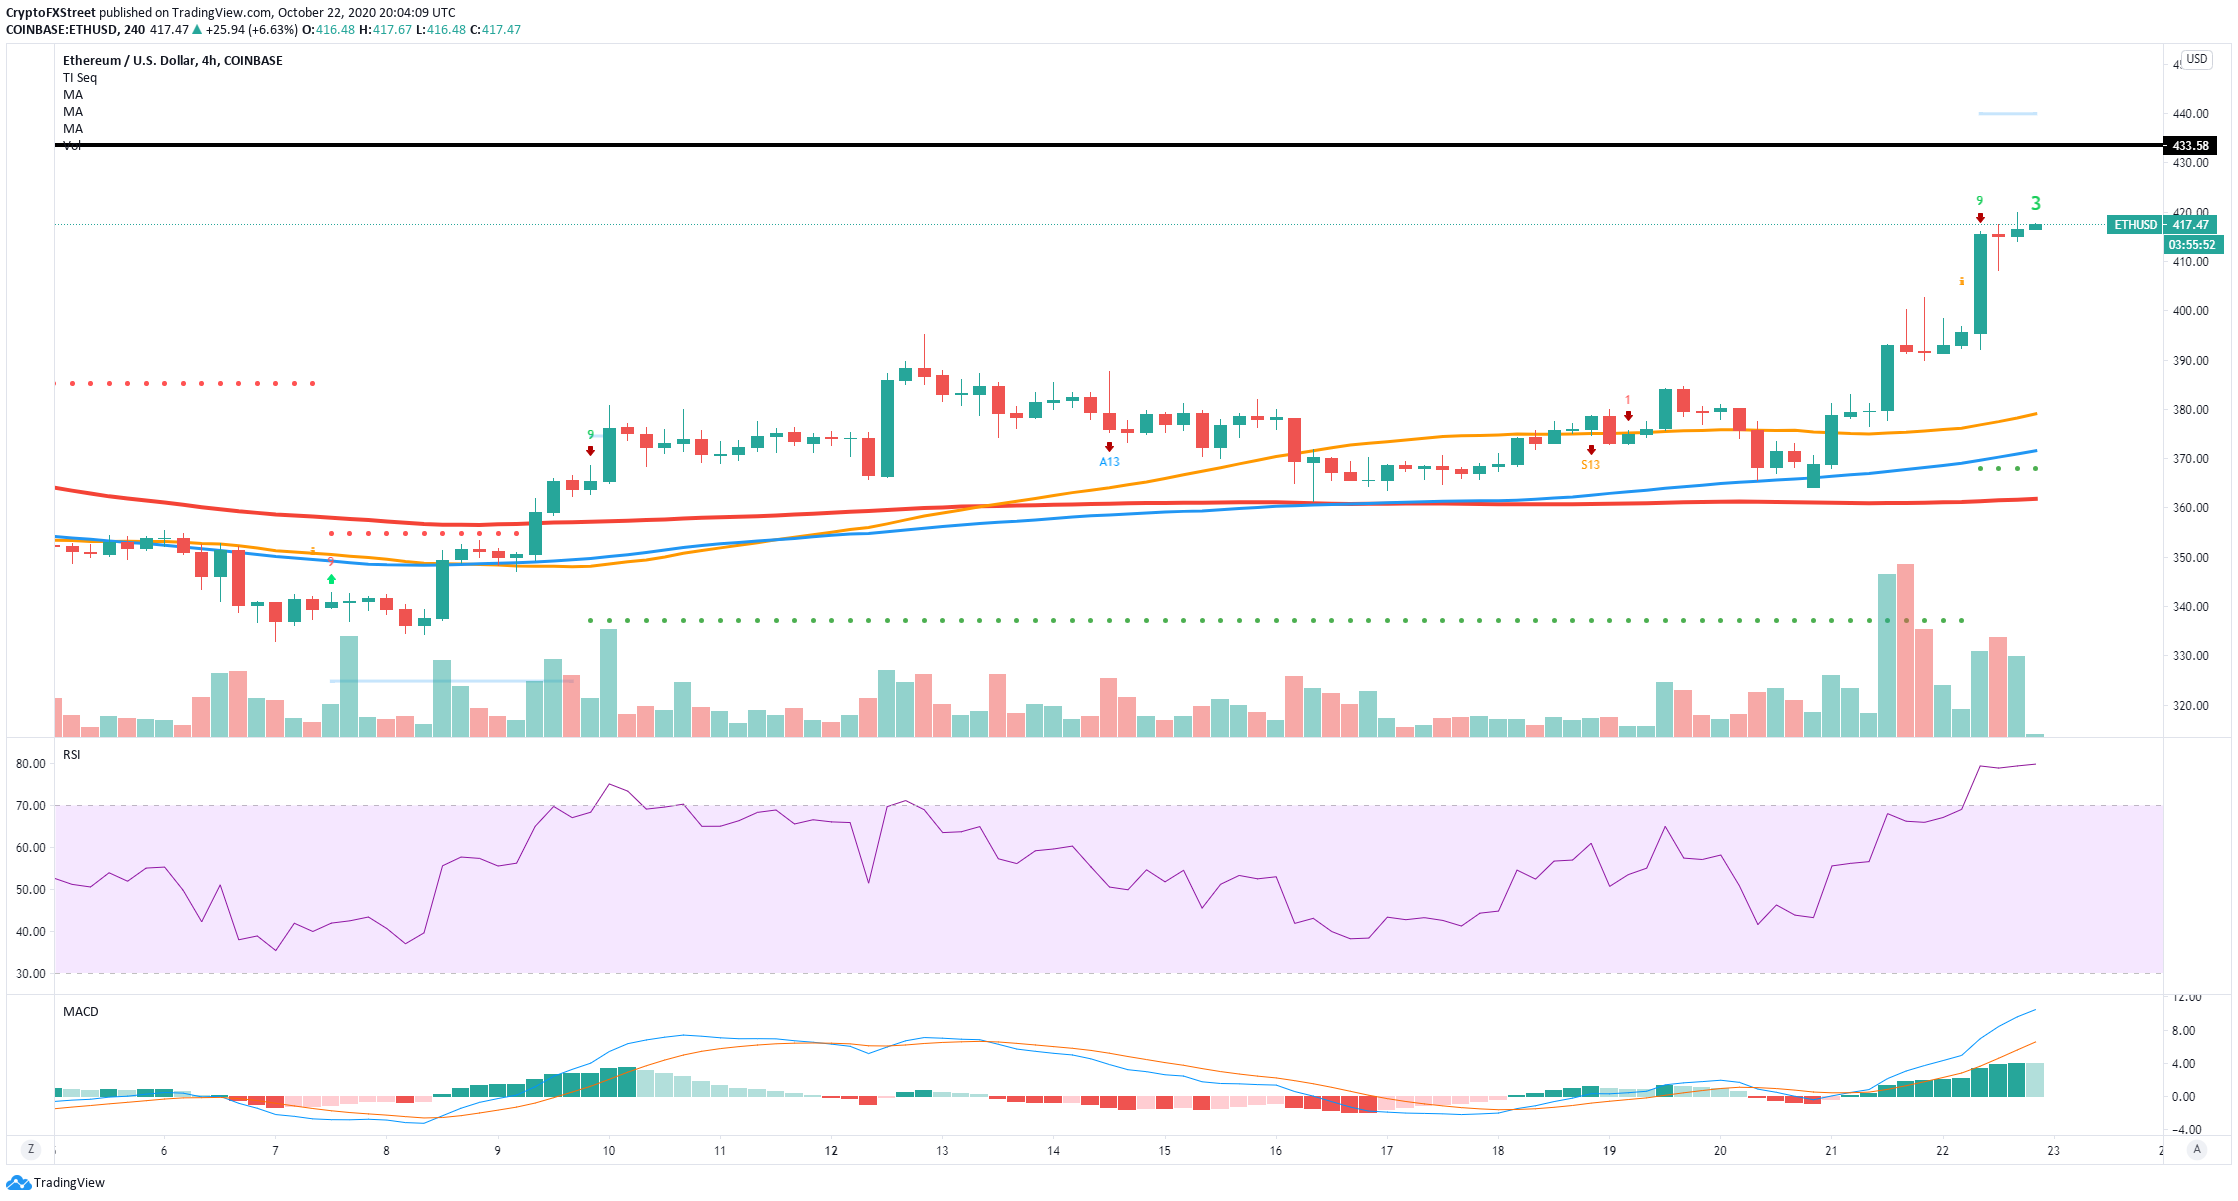
Observing the shorter time-frames like the 4-hour chart, we notice the TD sequential indicator presenting a sell signal. At the same time, the RSI remains heavily overextended, which usually has been accurate in predicting short-term pullbacks.
It also seems that the number of new addresses joining the Ethereum network is decreasing by around 20% in the past seven days. Confirmation of the sell signal on the 4-hour chart could bring the digital asset down to $400 to retest the psychological level.
Critical price levels for Ethereum holders
The current bullish momentum is undoubtedly positive for ETH holders, which are eying up a potential price target at $800 with very little resistance ahead. Confirmation of the double bottom pattern and a full reversal can get the digital asset there.
On the other hand, bears are trying to take control in the short-term thanks to a sell signal presented by the TD sequential indicator on the 4-hour chart. Validation of the call can make Ethereum slip to the psychological level at $400.
Author

Lorenzo Stroe
Independent Analyst
Lorenzo is an experienced Technical Analyst and Content Writer who has been working in the cryptocurrency industry since 2012. He also has a passion for trading.


