Ethereum price makes new record high as ETH transitions from follower to leader
- Ethereum price reasserting leadership in the cryptocurrency complex.
- ETH/BTC breaking into new highs from a cup pattern.
- On-chain metrics feature strong support for a continuation of the rally.

Ethereum price is decoupling from the Bitcoin universe and printing new highs today on the largest daily volume since February 24. The resistance at the 161.8% Fibonacci extension of the February decline at $2,504 is proving a challenge for the second time in two weeks. The bullish on-chain metrics combined with the notable outperformance versus Bitcoin positions ETH to continue attacking new price highs.
Ethereum on-chain metrics prove ETH undervalued
The Santiment MVRV 30D (measures whether an asset is overvalued or undervalued) is 14.95% and well below the 20% level, often associated with the beginning of the overvalued zone. It is projecting further gains for ETH moving forward.
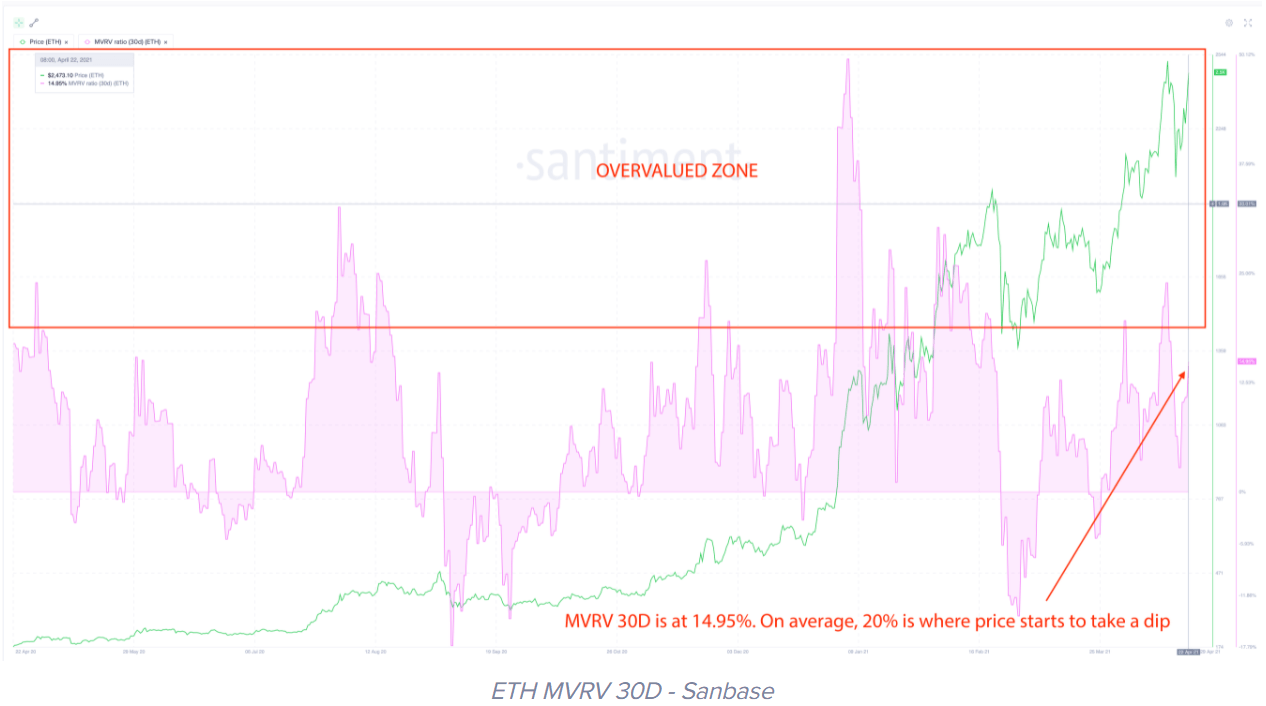
ETH Santiment MVRV 30D data
ETH’s daily active deposits (the number of unique depositors to exchanges) have declined significantly since the latter months of 2020. It indicates that most market operators are “hodling” instead of shifting to the exchanges to sell. If the smart contracts giant continues to rally, as expected, it will eventually compel people to lock in some profits. For now, as long as it remains lower than 2020, everything is okay.
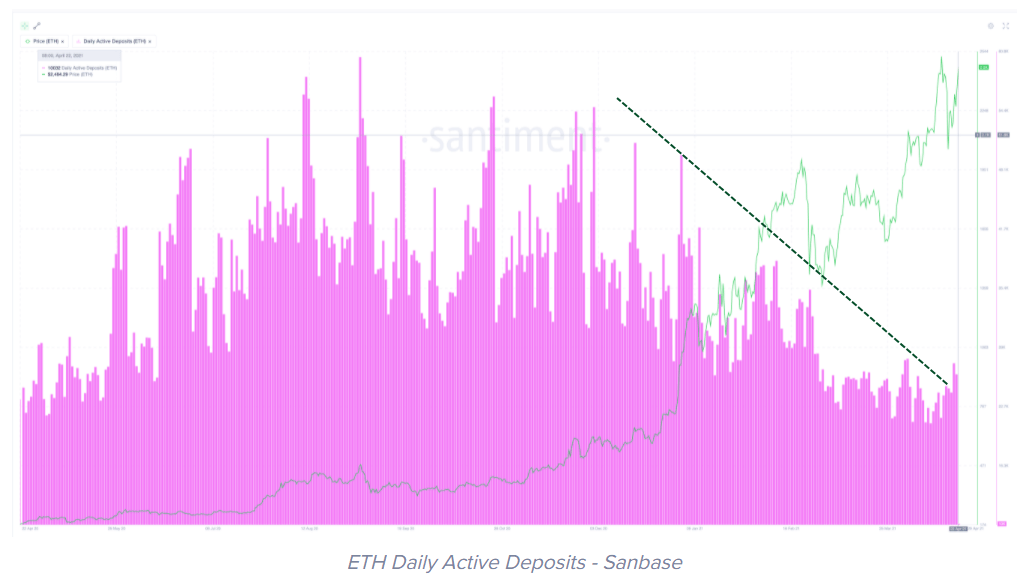
ETH Santiment DAD data
Ethereum price showing relative strength and stronger momentum
In mid-January, ETH/BTC broke out from a multi-year head-and-shoulders bottom but ran directly into the 50% retracement level and fell back into the base. Over the last four weeks, the pair has rallied strongly and is breaking out from a cup pattern while slashing through the downtrend in the weekly Relative Strength Index (RSI).
The original head-and-shoulders bottom had a measured move of over 150%, equating to a price of $0.104. ETH has shown in the past that it can outperform BTC for sustained periods of time, making the measured move target a possibility in the long term. The periods are shown in the chart below in the form of the number of days.
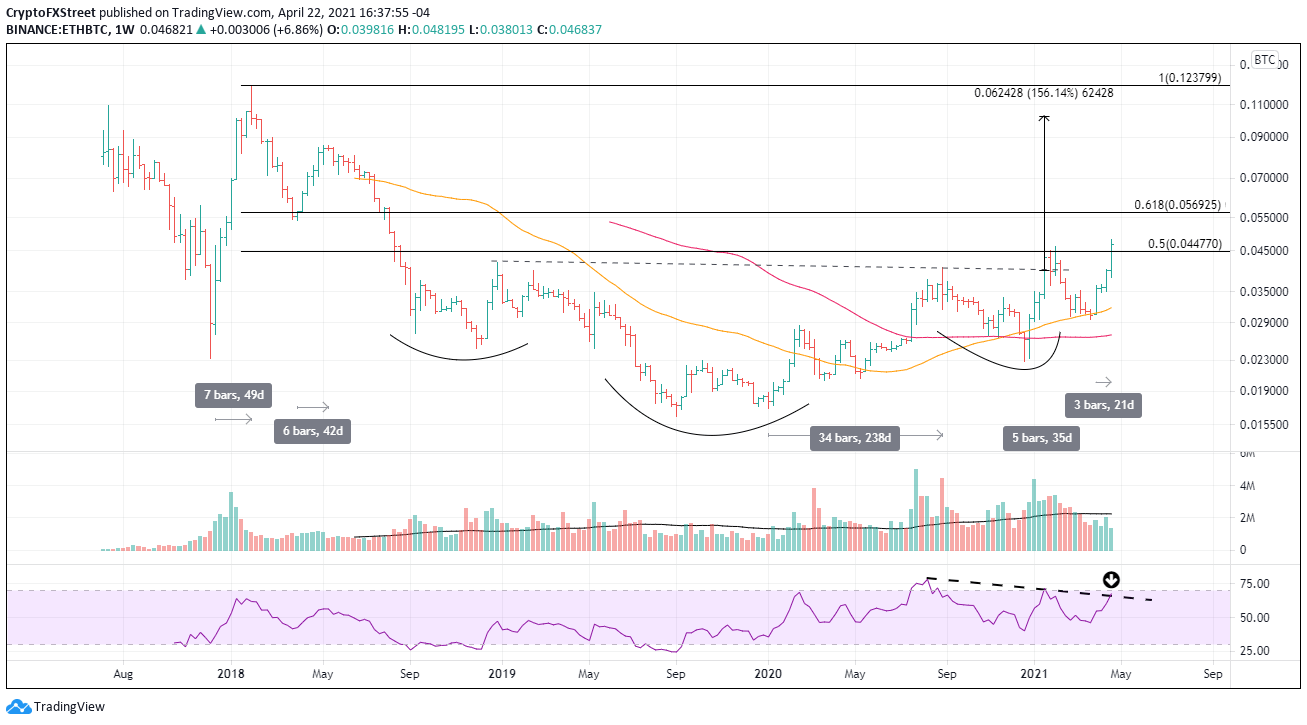
ETH/BTC weekly chart
Over the last three days, ETH has impulsively rallied into new highs while BTC has lingered below crucial supports. The positive divergence should continue in the days and weeks ahead as the digital token commands more interest in the area of adoption that has primarily been bestowed on Bitcoin.
It is critical for the bullish outlook that ETH closes weekly above the 161.8% extension of the February decline at $2,504. If accomplished, the following technical challenge is the 161.8% extension of this April decline at $2,886.
A blow-off move could hit the 261.8% extension of the February decline at $3,252 and then the 261.8% extension of the April decline at $3,434.
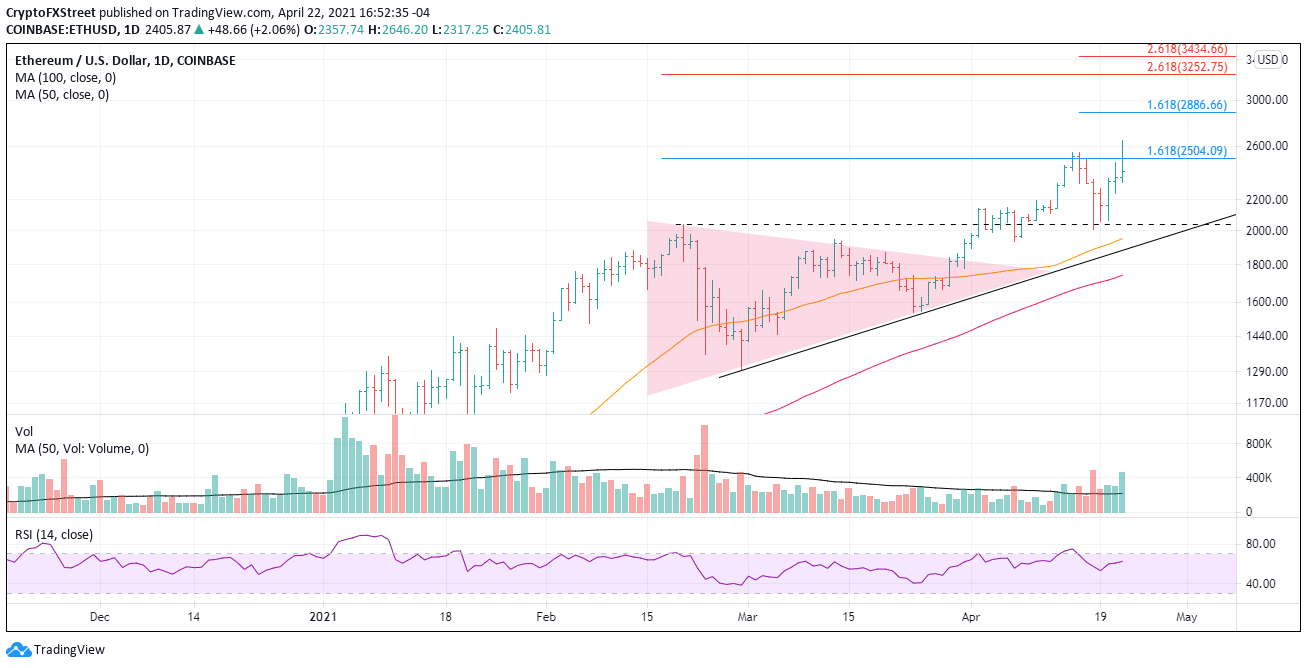
ETH/USD daily chart
Now, market participants need to note the selling this afternoon after the new high and consider the potential for a double top for ETH. Support begins with the February high at $2,041, drops to the 50-day SMA at $1,951, and then to the rising trendline at $1,880. Heavier selling would put the 100-day SMA at $1,741 in play.
Author

Sheldon McIntyre, CMT
Independent Analyst
Sheldon has 24 years of investment experience holding various positions in companies based in the United States and Chile. His core competencies include BRIC and G-10 equity markets, swing and position trading and technical analysis.


