Top 3 Price Prediction Bitcoin, Ethereum, Ripple: WeWork and Venmo join the Bitcoin craze while prices consolidate
- Bitcoin price sell-off was projected by glaring deteriorating technicals.
- Ethereum price rebound will be challenged by the broader crypto oscillations, not just Bitcoin.
- XRP price correction of over 40% shows no secure positions for speculators.

The announcement by WeWork that it will begin accepting payments in select cryptocurrencies, including Bitcoin, Ethereum, USD Coin, Paxos, and several others, is another sign of adoption and follows the decision by Tesla to do the same. It can be used to pay for membership if firms want to, and Coinbase, the cryptocurrency exchange, will be the first to pay for its membership using cryptocurrency, but with what currency is still unknown.
Additionally, WeWork will pay landlords and third-party partners in cryptocurrencies where they are happy to accept this via Coinbase. WeWork CEO, Sandeep Mathrani, is proud of the efforts by WeWork to be “at the forefront of innovative technologies, finding new ways to support our members.”
Moving forward, the collective crash in the cryptocurrency complex this weekend was a jolting reminder of the risk-reward dynamics that govern the market and the increased leverage in the prominent cryptocurrencies. Moreover, should not overlook that the complex was ripe for downside volatility in light of the deteriorating technical backdrop, as was the case with Bitcoin or the hyper-extended conditions, in the case of Ripple.
Bitcoin price sell-off was projected by deteriorating technicals
It was expressed in previous FXStreet Top 3 articles that BTC was illustrating a rising wedge and that it was vulnerable to a quick decline after struggling with resistance at the 361.8% Fibonacci extension of the 2017-2018 bear market at $63,778. Additionally, there was declining momentum as the weekly Relative Strength Index (RSI) was flashing a negative divergence with price for the second time since the February high.
Moving forward, BTC is in a highly vulnerable position on the daily chart. It is now locked below the lower trend line of the rising wedge and, more importantly, below the 50-day simple moving average. A moving average that the bellwether cryptocurrency has held since the beginning of October 2020. It is the first sign of a possible trend change.
Support still remains at the March low at $50,305. A decline below on a daily closing basis would be the first lower low in 2021, marking another bearish development for Bitcoin.
The next support is the 100-day SMA at $48,989, followed by the close interaction of the February low at $43,016, the January high at $41,986, and the 38.2% retracement of the 2020-2021 advance at $41,581. It would represent an additional loss of over 20% from current prices, but it would reset the daily RSI for a new rally.
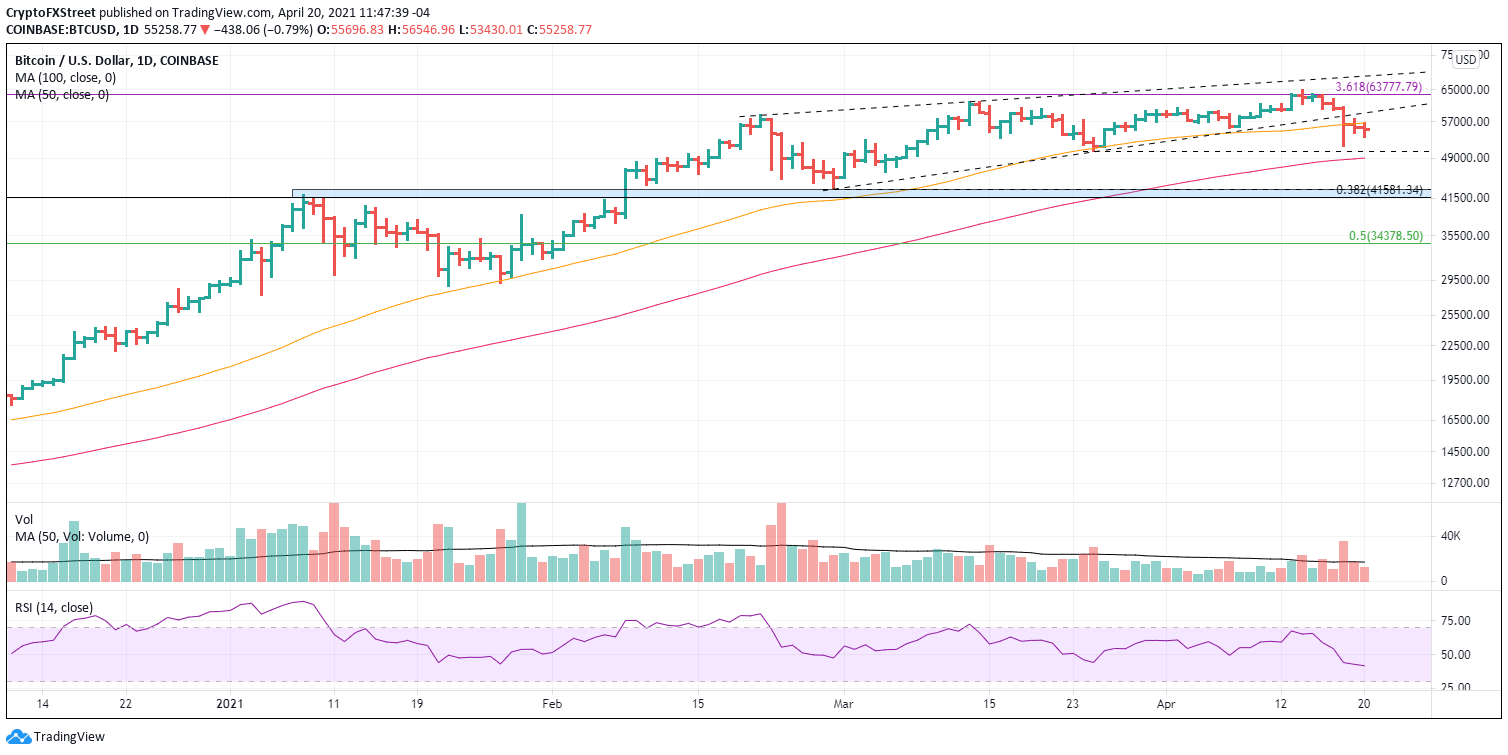
BTC/USD daily chart
A switch to a neutral outlook can begin if Bitcoin price registers a daily close above the wedge’s lower trendline at $59,170. Again, the 361.8% extension of the 2017-2018 bear market is credible resistance, followed by the wedge’s upper trendline currently at $68,750.
Ethereum price advance may endure, but not without a close call
Unlike Bitcoin, ETH did hold necessary support on the weekend and early this week, saving the bullish outlook from being downgraded. Currently, the smart contracts giant is bouncing from the February high at $2,041.42 for the third consecutive day. Immediate resistance is the 161.8% extension of the 2018 bear market at $2,247 and then the 161.8% extension of the February correction at $2,504, which is where the rally stalled.
If the Fibonacci cluster is cleared, ETH should rally to the 261.8% extension of the February decline at $3,253 and potentially the 261.8% extension of the 2018 bear market at $3,587.
It is important to note that Ethereum price may close today with two consecutive inside days, indicating selling exhaustion.
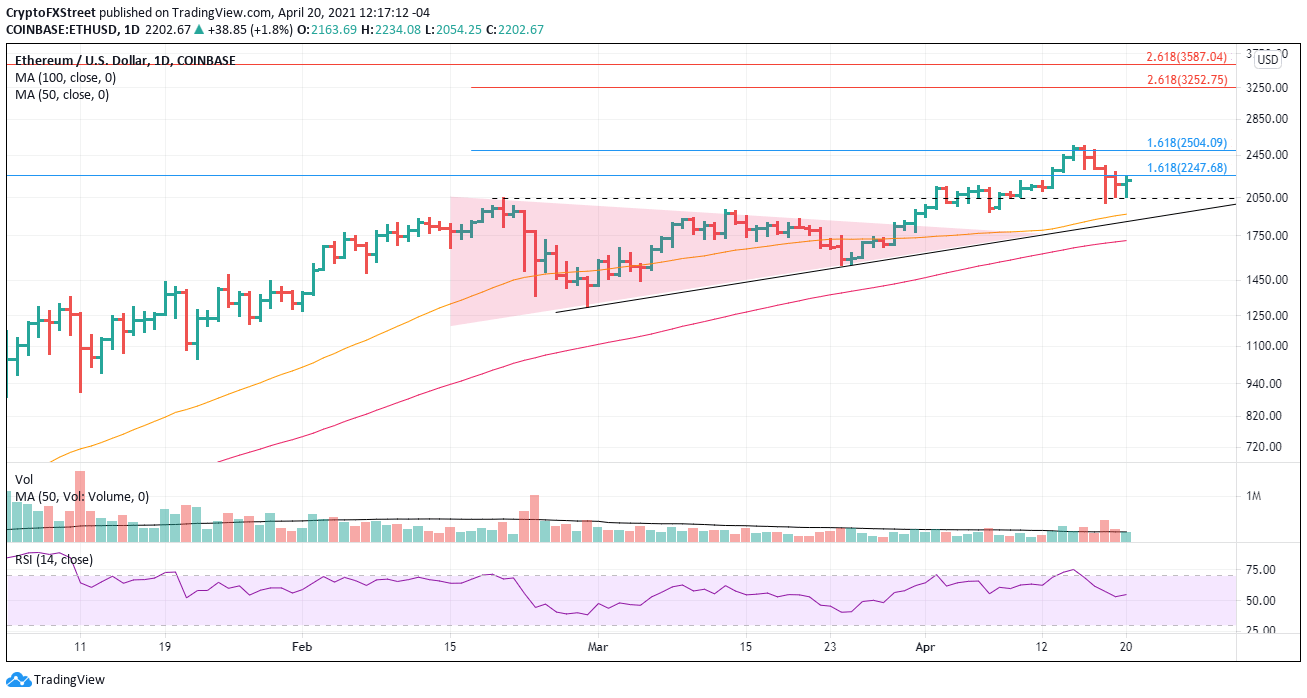
ETH/USD daily chart
With Bitcoin in a far more precarious technical situation, speculators need to be mindful of the downside support. Everything changes with a daily close below the February high. Ensuring support is at the 50-day SMA at $1,914.27, then the rising trendline from the February low currently at $1,850 and finally at the 100-day SMA at $1,713.
XRP price weakness should be bought around $1.10
It is difficult to argue that an uptrend is intact after falling over 40%, but that could be the case with Ripple. The international settlements token faces a challenge to test the rally high at $2 as equally sharp rallies rarely follow significant corrections. It is likely not to change with Ripple.
Speculators should use weakness to initiate new positions and focus on the convergence of the April 6 pennant high at $1.12 with the 61.8% retracement of the April rally at $1.09 as the entry point. If this is a correction, any downside should be limited at the psychologically important $1, thereby creating the possibility of a double bottom and a second entry point.
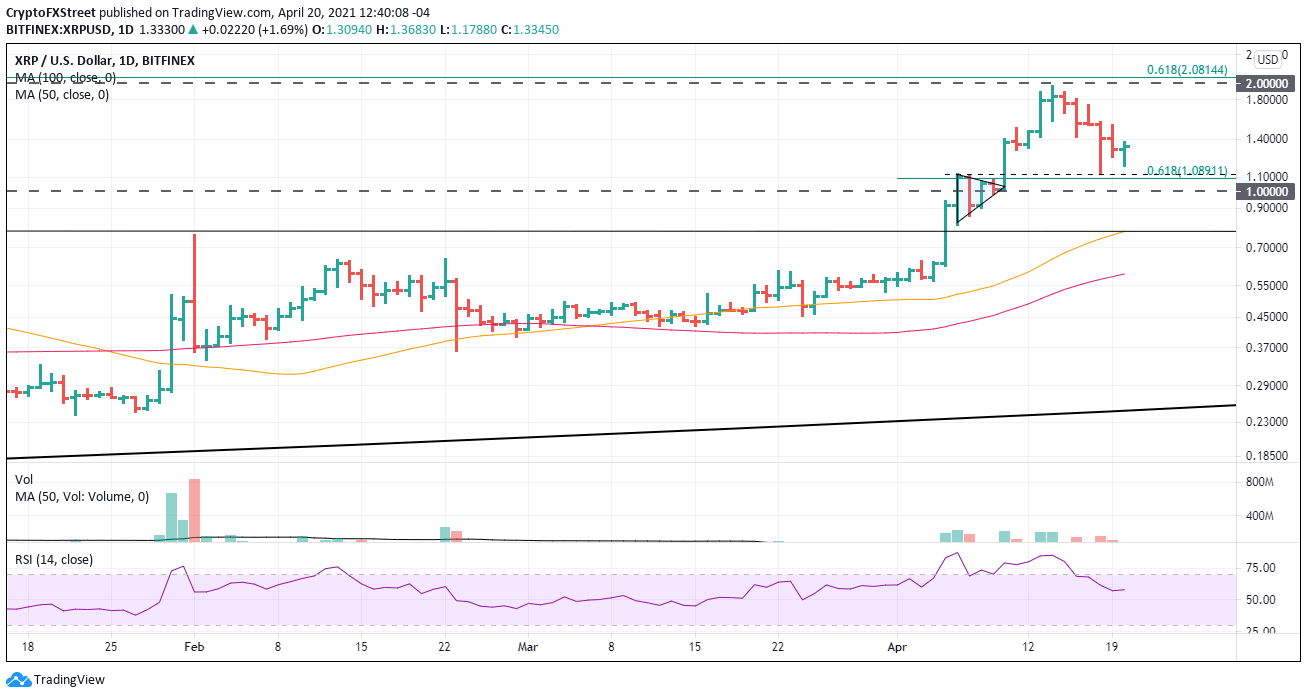
XRP/USD daily chart
A failure to hold $1 leaves speculators exposed to a quick collapse to $0.80, leaving a test of the all-time high for later in the year.
Author

Sheldon McIntyre, CMT
Independent Analyst
Sheldon has 24 years of investment experience holding various positions in companies based in the United States and Chile. His core competencies include BRIC and G-10 equity markets, swing and position trading and technical analysis.


