Ethereum price highlights strong bullish divergence on daily timeframe, downtrend may be nearing an end
- Ethereum price is down 10% in just under two weeks after a failed breakout past the $1,700 psychological level.
- With a bullish divergence in play, however, ETH downtrend could be capped, with the altcoin eyeing 5% gains into $1,600.
- Invalidation of the bullish outlook will occur if the proof-of-stake token records a daily candlestick close below $1,505.

Ethereum (ETH) price has been on a downtrend for the past several weeks, recording lower lows and lower highs. It comes amid shrinking correlation with Bitcoin (BTC) as the king of cryptocurrency tries to pull back after another failed attempt at a breakout.
Also Read: Ethereum falters as it faces supply inflation and whale offloading pressure
Ethereum FAQs
What is Ethereum?
Ethereum is a decentralized open-source blockchain with smart contracts functionality. Serving as the basal network for the Ether (ETH) cryptocurrency, it is the second largest crypto and largest altcoin by market capitalization. The Ethereum network is tailored for scalability, programmability, security, and decentralization, attributes that make it popular among developers.
What blockchain technology does Ethereum use?
Ethereum uses decentralized blockchain technology, where developers can build and deploy applications that are independent of the central authority. To make this easier, the network has a programming language in place, which helps users create self-executing smart contracts. A smart contract is basically a code that can be verified and allows inter-user transactions.
What is staking?
Staking is a process where investors grow their portfolios by locking their assets for a specified duration instead of selling them. It is used by most blockchains, especially the ones that employ Proof-of-Stake (PoS) mechanism, with users earning rewards as an incentive for committing their tokens. For most long-term cryptocurrency holders, staking is a strategy to make passive income from your assets, putting them to work in exchange for reward generation.
Why did Ethereum shift from Proof-of-Work to Proof-of-Stake?
Ethereum transitioned from a Proof-of-Work (PoW) to a Proof-of-Stake (PoS) mechanism in an event christened “The Merge.” The transformation came as the network wanted to achieve more security, cut down on energy consumption by 99.95%, and execute new scaling solutions with a possible threshold of 100,000 transactions per second. With PoS, there are less entry barriers for miners considering the reduced energy demands.
Ethereum likely to start correcting
Ethereum (ETH) price has been in a downtrend for the past two weeks. More broadly, the price has recorded lower lows since around August 18. Along with it, the Relative Strength Index (RSI) has recorded higher lows, recording a strong bullish divergence. The presence of an oversold condition on the RSI followed by the momentum indicator recording higher lows bolsters is suggestive of underlying strength.
This raises the possibility that Ethereum price’s downtrend could be nearing an end. Increased buying pressure above this level could see Ethereum price restore above the immediate hurdle at $1,547, or higher to confront the $1,599 supplier congestion level.
In a highly bullish case, the gains could extend for Ethereum price to test the supply zone extending from $1,666 to $1,736. A decisive move above its midline at the $1,700 psychological level would confirm the uptrend.
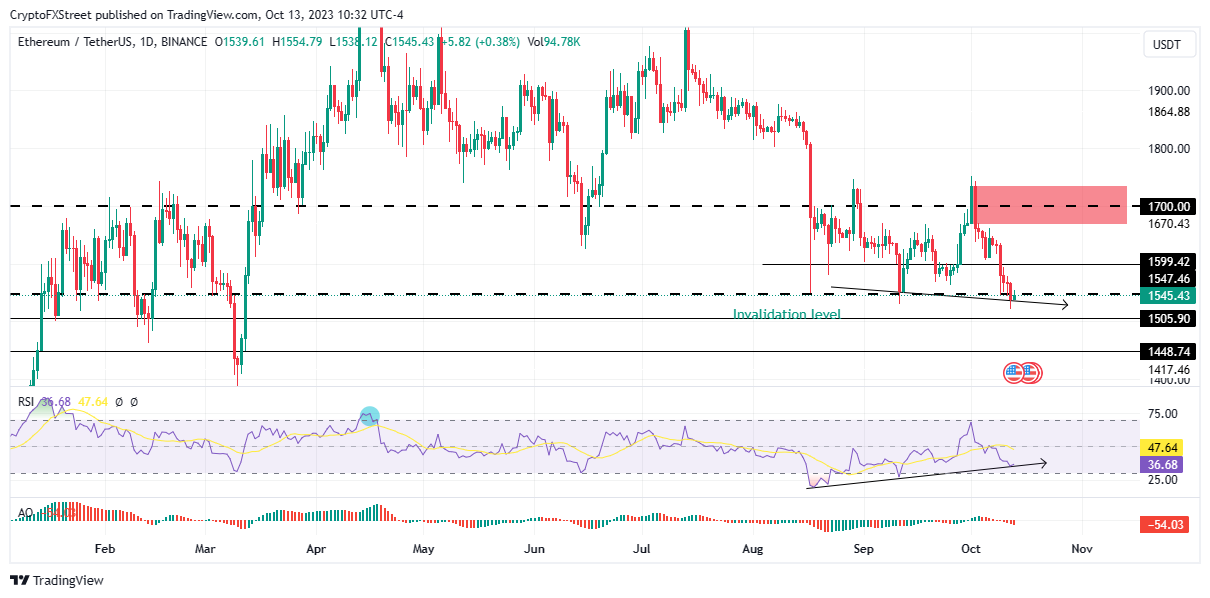
ETH/USDT 1-day chart
On the flipside, the position of the RSI below the 50 level, coupled with the Awesome Oscillator (AO) position in the negative territory shows that bears still maintain a presence in the ETH market. As such, downside potential remains plausible, potentially sending ETH below the immediate support at $1,547.
Further south, the downtrend could extend below the subsequent support at $1,505. A break and close below this level would invalidate the bullish thesis. In the dire case, ETH could slump further to reach the March 12 low at $1,448. Such a move would constitute a 6% fall below current levels.
Author

Lockridge Okoth
FXStreet
Lockridge is a believer in the transformative power of crypto and the blockchain industry.


