Ethereum Price Forecast: ETH on-chain metrics remain strongly bullish, upswing to $1,500 eyed
- Ethereum recovery could ride on the improving on-chain metrics.
- The percentage of Ethereum supply on exchanges falls to a three-month low, which is a bullish signal.
- Ether must hold above the 50 SMA on the 4-hour to avoid losses that may retest $1,200 and perhaps $1,000.

Ethereum has tumbled by roughly 18% from its recently achieved new all-time high at $1,481. The flagship token tested the support at $1,200 before rebounding strongly to the prevailing price level of around $1,270. The rebound is reminiscent of the bullish outlook in on-chain metrics, suggesting that Ether is not done with the rally just yet. Therefore, the community can expect another significant leg up.
Ethereum on-chain metrics hold positively, ignoring the recent breakdown
Ethereum on-chain metrics continue to display a bullish picture, further validating the possibility of another breakout. According to Santiment, a renowned on-chain analysis platform, the coin supply on exchanges and the amount of ETH held by top exchange addresses had dropped significantly in the last 90 days.
For instance, top whale exchange addresses currently stand at approximately 7.4 million ETH, down from nearly 12.9 million in November 2020. Similarly, only 20.7% of the Ethereum supply is currently circulating on the exchanges.
%20[06.04.57,%2028%20Jan,%202021]-637474022539943073.png)
Ethereum coin supply on exchange/amount held by top exchange addresses chart
The significant drop in both of these parameters is a bullish indicator for Ethereum. Earlier this week, FXStreet reported the massive exodus of Ethereum tokens from exchanges, which adds credibility to the bullish narrative.
Ethereum NUPL still in capitulation
Consequently, the Net Unrealized Profit/Loss (NUPL) metric suggests that Ethereum still has room for growth before the market hits euphoria. The NUPL refers to "the difference between Relative Unrealized Profit and Relative Unrealized Loss." The same figure will be arrived at if the realized cap is subtracted from the market cap.
The chart below shows Ethereum is in capitulation (red). Despite the bull run from 2020, the NUPL is still under the zero line. It means that very few holders are willing to sell and are likely to hold until the figure crosses above the midline.
Ethereum global market top will come into the picture when the NUPL hits the greed range (blue). In other words, Ethereum is far from its local top, and the rally is bound to continue in the coming weeks, maybe months. For more on this on-chain metric, check out this article.
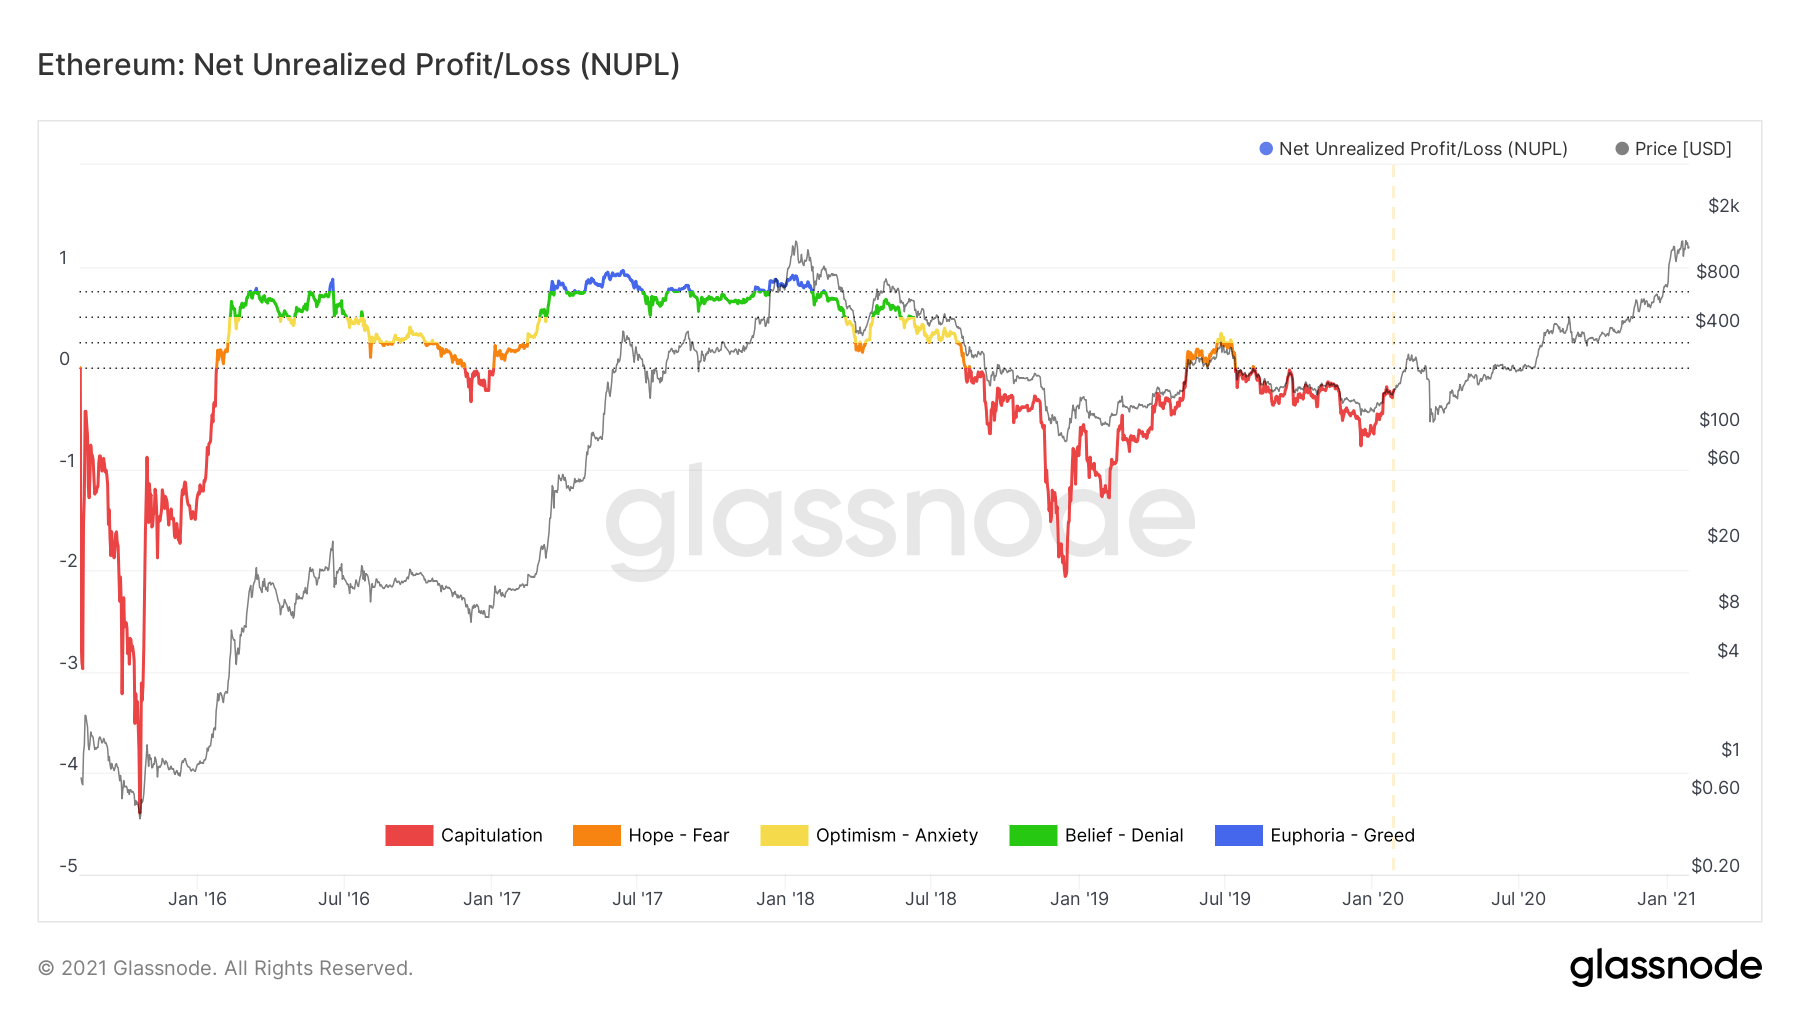
Ethereum NUPL chart
Ethereum short-term picture turns bullish
Ethereum is trading above the 50 Simple Moving Average on the 4-hour chart. The action comes after rebounding from the support at $1,200. Moreover, the cryptocurrency asset is doddering near the apex of a falling wedge.
The pattern develops after the price forms a series of lower highs (connected by a trendline) and lower lows (also tied using a trendline). In technical analysis, falling wedge patterns highlight periods of consolidation after an upward extend move in price. A breakout is usually anticipated before the trendlines meet.
For now, Ethereum must bring down the resistance at the 100 SMA to add credence to the uptrend. Trading above the wedge pattern would validate the upswing to $1,400 before bulls plan the next move to $1,500.
%20-%202021-01-28T062828.951-637474022663860452.png)
ETH/USD 4-hour chart
Looking at the other side of the fence
Ethereum must hold above the 50 SMA to stay in the uptrend. Otherwise, if this support is lost, losses may revisit the recent anchor at $1,200. Note that Ethereum almost hit $1,000 last week, suggesting that if the downward force is strong enough, losses could stretch toward $900.
Author

John Isige
FXStreet
John Isige is a seasoned cryptocurrency journalist and markets analyst committed to delivering high-quality, actionable insights tailored to traders, investors, and crypto enthusiasts. He enjoys deep dives into emerging Web3 tren


