- Ethereum price breaks below a critical trend line, opening room for a correction.
- ETH price could be set to tank 6% today before finding support.
- Expect to see the uptrend continue with a return to $3,687
Ethereum (ETH) price delivered a distress signal to markets after bulls were unable to defend a key ascending trend line – coloured green on the chart below. Instead, bulls caved under the bearish pressure, with markets on the back foot for the second day in a row as investors saw no signs of relief from Ukraine, and more tail risks probably set to materialise in the coming weeks. With those tail risks hanging over investors, a quick wave of profit-taking got underway, drying up the demand side, and bulls swinging to the sell-side to cash in for the time being.
Ethereum price sees bulls dropping positions with $3,100 at risk to the downside
Ethereum price hit a curb this week after running into the 200-day Simple Moving Average (SMA) at $3,500. With that rejection, bears seized the opportunity to get in short again as a relief rally proved to be unsupported by facts and poured cold water on the party. With that break of moral ETH price broke below the green ascending trend line that has been a vital support for the uptrend since the beginning of March.
ETH price is already too far out to still retrace and pop back above $3,391.25 That would mean at least a 5% rally, and with traders sitting on their hands until the Nonfarm Payrolls comes out of the US, there is only a tiny window of opportunity. Add to that the fact that the Relative Strength Index (RSI) is only now back below the ‘overbought’ area, and it seems highly unlikely bulls will be stepping in in size now, but rather instead may wait for $3,100, with the monthly pivot or $3,018.55 which holds historical importance, before seeing bulls buying the dip.
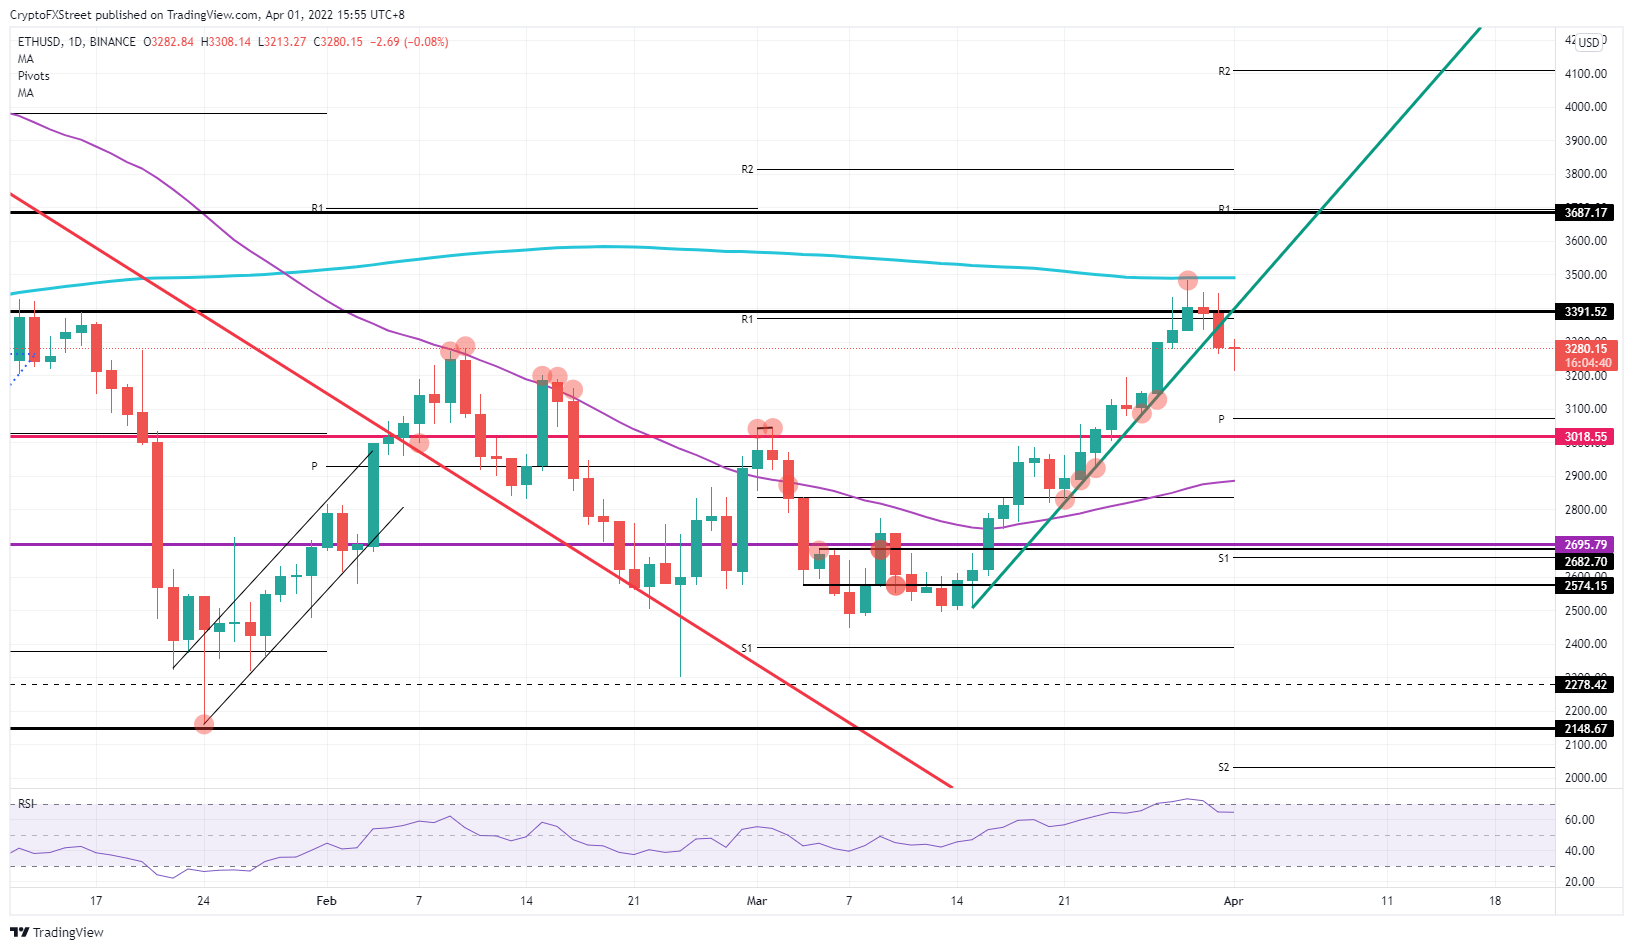
ETH/USD daily chart
With talks still ongoing, a possible further guarantee or breakthrough with a cease-fire that is upheld by Russia during the weekend, for example, could trigger a bullish relief rally and see price action pumped up again towards $3,391.52 That would be the perfect position to go into the weekend and set the scene for a test and break above the 200-day SMA and target $3,687.17next week. That would mean that around 13% of profits are on the table in the coming week.
Information on these pages contains forward-looking statements that involve risks and uncertainties. Markets and instruments profiled on this page are for informational purposes only and should not in any way come across as a recommendation to buy or sell in these assets. You should do your own thorough research before making any investment decisions. FXStreet does not in any way guarantee that this information is free from mistakes, errors, or material misstatements. It also does not guarantee that this information is of a timely nature. Investing in Open Markets involves a great deal of risk, including the loss of all or a portion of your investment, as well as emotional distress. All risks, losses and costs associated with investing, including total loss of principal, are your responsibility. The views and opinions expressed in this article are those of the authors and do not necessarily reflect the official policy or position of FXStreet nor its advertisers. The author will not be held responsible for information that is found at the end of links posted on this page.
If not otherwise explicitly mentioned in the body of the article, at the time of writing, the author has no position in any stock mentioned in this article and no business relationship with any company mentioned. The author has not received compensation for writing this article, other than from FXStreet.
FXStreet and the author do not provide personalized recommendations. The author makes no representations as to the accuracy, completeness, or suitability of this information. FXStreet and the author will not be liable for any errors, omissions or any losses, injuries or damages arising from this information and its display or use. Errors and omissions excepted.
The author and FXStreet are not registered investment advisors and nothing in this article is intended to be investment advice.
Recommended Content
Editors’ Picks
Ripple's move above this key level could trigger nearly 50% rally for XRP
Ripple has overcome a critical resistance level and flipped into a support floor on the weekly time frame. This development happened while XRP tightly consolidated for roughly 250 days. Investors can expect XRP to kickstart a massive rally.
Optimism price outlook with nearly $90 million worth of OP tokens flooding markets on Friday
Optimism volatility has shrunk in the ours leading to the network’s cliff unlock. It joins the likes of dYdX and Sui, which have similar events on their calendars. As token unlocks are often considered bearish catalysts, investors should brace for a reaction after the event.
Top 3 Price Prediction Bitcoin, Ethereum, Ripple: Retail watches from the sidelines with a bias for shorts
Bitcoin could clear $73,777 peak as BTC bulls resurface. Ethereum might fall 10% before next leg up as ETH RSI teases with sell signal. XRP could lose $0.6000 threshold as Ripple bulls fail to show up.
Jito price could hit $6 as JTO coils up inside this bullish pattern
Jito price action shows a potential cup and handle formation. Based on theoretical measurement rules, a successful breakout could yield a 56% rally to $6.0. A breakdown of the $3.86 support level would create a lower low for JTO and invalidate the bullish thesis.
Bitcoin: BTC may have recovered, but is it out of the woods?
Bitcoin’s (BTC) upward momentum has shown a significant decline for the past two weeks or so. This development led to a bearish signal on the weekly and an uncertain outlook on the monthly.