|

Ethereum price favors the bulls but ETH topside is capped at $4,000

  • Ethereum (ETH) came off $4,100 at the end of August and looked for support.
  • ETH support came in the first week of September around $3,018.
  • The correction was an excellent opportunity for buyers to step in and make future ETH price action in favor of bulls.

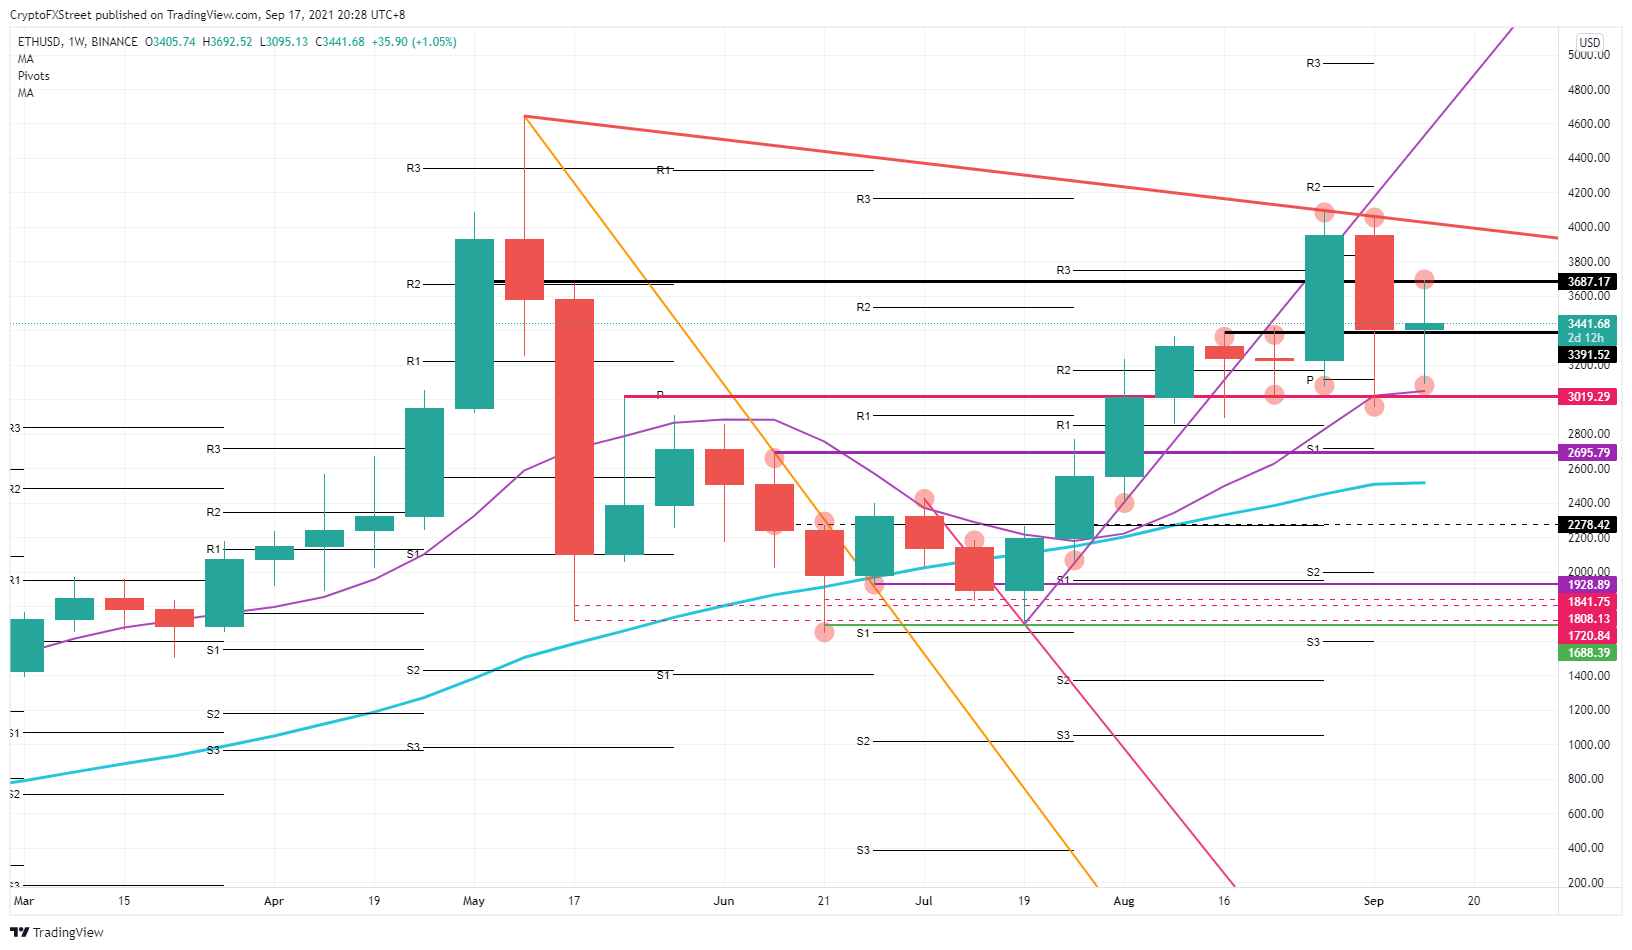
Ethereum (ETH) hit a curb at the beginning of September. With the full retrace of the profitable price action the week before, a descending trend line formed and is limiting further expectations to the upside. Buyers seized the opportunity around $3,018 to add Ethereum to their current or new positions. 

Ethereum price is ready for a third test of the cap, near $4,000

Ethereum bulls pulled the trigger on their buy-orders and stepped in near the 55-day Simple Moving Average (SMA) and the historical level of $3,018 originating from mid-May. This entry was offered to the buyers last week and this week. This way, volume is added to the rally, and the pullback was a perfect moment for ETH to have a cooldown. 

An instant retest towards the red descending trend line at the top side is not unfolding already because sellers are defending an intermediary entry-level of them at $3,687. That level originates from mid-May and coincides as well with the R2 resistance level from May. This makes this a pretty substantial resistance medium-term.
ETH/USD weekly chart

ETH/USD weekly chart

Expect bulls to sit and wait for their profit targets to arise. The resistance at $3,687 will either break this week or next week. Once through there, it will be essential to see how ETH price action wil behave near $4,000 and that descending top line. For the bulls, the 55-day SMA will edge up as well and act as a supporting factor. 

If sellers can overhaul price action and test $3,019, expect a lower break towards $2,695. That level falls in line with the monthly S1 support level and has not been tested thus far on its support. So expect this level to stand firm against the first attempt from sellers.

Author

Filip Lagaart

Filip Lagaart is a former sales/trader with over 15 years of financial markets expertise under its belt.

More from Filip Lagaart
Share:

Editor's Picks

Pepe Price Forecast: PEPE signals trend reversal amid a short squeeze

Pepe price is up nearly 30% in the last 24 hours, outperforming most top cryptocurrencies and hinting at further upside potential. Derivatives data suggest a short squeeze of more than $2 million during the same period, forcing traders to buy back positions in the meme coin. The technical outlook for PEPE indicates an upside bias as bullish momentum strengthens.

Crypto Overview: Bitcoin tops $85,000 post-CLARITY Act failure – TAO and FET lead gains

Bitcoin price trades above $85,000 maintaining a constructive tone amid positive institutional inflows, Strategy’s first BTC purchase since August, and alternative regulatory expansions following the CLARITY Act's failure. AI tokens such as Bittensor (TAO) and FET have emerged as top performers over the last 24 hours.

Ripple and Stellar outlook: Momentum improves as bulls target further gains

Ripple (XRP) and Stellar (XLM) stabilize after extending their gains by nearly 9% at the start of the week. Improving momentum indicators support XRP and XLM bullish price action and hint at further rally. Meanwhile, traders should remain cautious as mixed derivatives data could limit upside as both tokens try to sustain their recent upswing.

Ethereum Price Forecast: ETH rallies above $2,700 as investors shrug off bearish sentiment

Ethereum climbed above $2,700 on Monday after investors defended the realized price level despite negative sentiment over the Clarity Act's failure and the Federal Reserve rate hike. After the Clarity Act failed to advance in the Senate, ETH dipped below $2,400 last week. But right below that price is the top altcoin's realized price, or average on-chain cost basis, at $2,310.

Bitcoin: BTC shrugs off CLARITY Act setback and hawkish Fed
Bitcoin (BTC) price action has remained resilient this week, trading above $78,000 at the time of writing on Friday, heading toward a key resistance zone. Institutional demand shows early signs of weakness, with spot Exchange Traded Funds (ETFs) on track for a second straight week of outflows, with over $420 million recorded through Thursday amid escalating Middle East tensions.