Ethereum price downside risks resurface amidst falling investor interest
- Ethereum price holds within a rectangle pattern after facing rejection at $1,400.
- Investors could be taking a hands-off approach until ETH price breaks out.
- Ethereum price must hold firmly to support at $1,300 to prevent further declines to $1,100.

Ethereum price is trading marginally above $1,300 after its bullish shoots were slashed at $1,400 on Tuesday. The presence of immense buyer congestion at $1,255 cut short the pullback that may very well have tagged $1,200. However, recovery to $2,000 could remain a pipe dream in the near term due to dwindling buyer interest.
Ethereum whales activate selling spree
Ethereum price has, since its Merge software upgrade, struggled to hold key support areas. Bullish trend reversals have also been elusive, but on-chain data from Santiment establishes that large volume investors have been busy emptying their wallets.
For instance, addresses holding between 1,000 and 10,000 coins have shrunk to 5,489 from 5,634, as recorded on September 14. A similar downtrend is reflected among addresses with 100,000 to 1,000,000 million coins which are down one spot from 130 to 129 in the same period.
Odds may continue playing against Ethereum price recovery as long as whales keep selling. In other words, Ethereum price is yet to tap its final floor price to ignite a sustainable uptrend in the short term.
 [15.51.32, 28 Sep, 2022]-637999693322780103.png)
Ethereum Supply Distribution
Rekt Capital, a renowned analyst, told his followers via Twitter that although Ethereum price may have respected its support at $1,300, waning buy interest is unlikely to sponsor a significant move north.
Compared to early 2021, the reaction from the same support was much more volatile, forming a downside wick. The analyst forecasts downside continuation to $1,100 if a new weekly candle closes below $1,300.
Indeed $ETH rejects at this orange area which is figuring as resistance
— Rekt Capital (@rektcapital) September 28, 2022
A new Weekly Candle Close below orange could set #ETH for downside continuation into at least the black ~$1100 #Crypto #Ethereum https://t.co/siItoZBKLu pic.twitter.com/fit5QSdQJc
A rectangle pattern formed on the four-hour chart reveals a choppy market. Ethereum price will likely trend sideways within the rectangle until a breakout occurs on either side (up or down). For now, the odds are in favor of the bears, especially with the Moving Average Convergence Divergence (MACD) crossing below the mean line into the negative region. Furthermore, its negative divergence from the price upholds this pessimistic analysis.
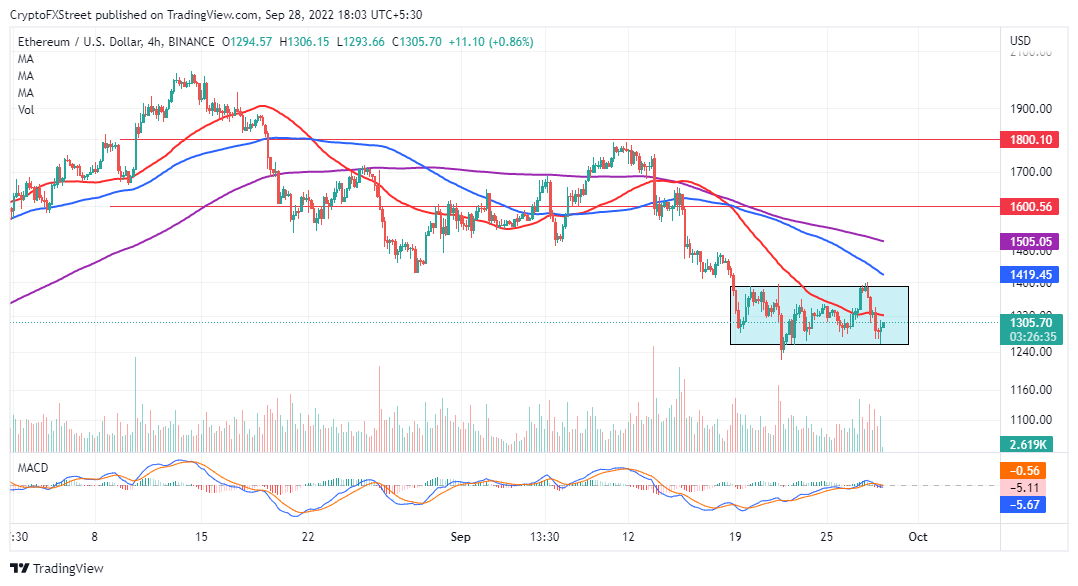
ETH/USD four-hour chart
If support at $1,300 remains intact, Ethereum price could start reaching out for a bullish breakout. Still, the 50-day SMA (Simple Moving Average – red) may continue limiting price action at $1,323. On the downside, Ethereum price will make good of the forecast to $1,100 if bears crack the support areas at $1,300 and $1,200, respectively.
Author

John Isige
FXStreet
John Isige is a seasoned cryptocurrency journalist and markets analyst committed to delivering high-quality, actionable insights tailored to traders, investors, and crypto enthusiasts. He enjoys deep dives into emerging Web3 tren



