Ethereum price could easily double as ETH long term outlook screams bullish
- Ethereum price has formed a chart pattern on the weekly chart that indicates an optimistic outlook of a 97% ascent.
- ETH must clear a few critical resistances before the bullish forecast could be validated.
- Holding above $3,917 is crucial for the token’s rise toward $10,000.

Ethereum price continues to consolidate and discover reliable support above $4,000. ETH appears to be preparing for a massive bull run, as a technical pattern suggests that the second-largest cryptocurrency by market capitalization is looking to double its value in the longer term.
Ethereum price eyes $10,000
Ethereum price has printed a bull pennant pattern on the weekly chart, suggesting that ETH is eyeing higher prices. The prevailing chart pattern suggests that if the token slices above the upper boundary at $5,252, a 97% ascent toward $10,418 is on the radar.
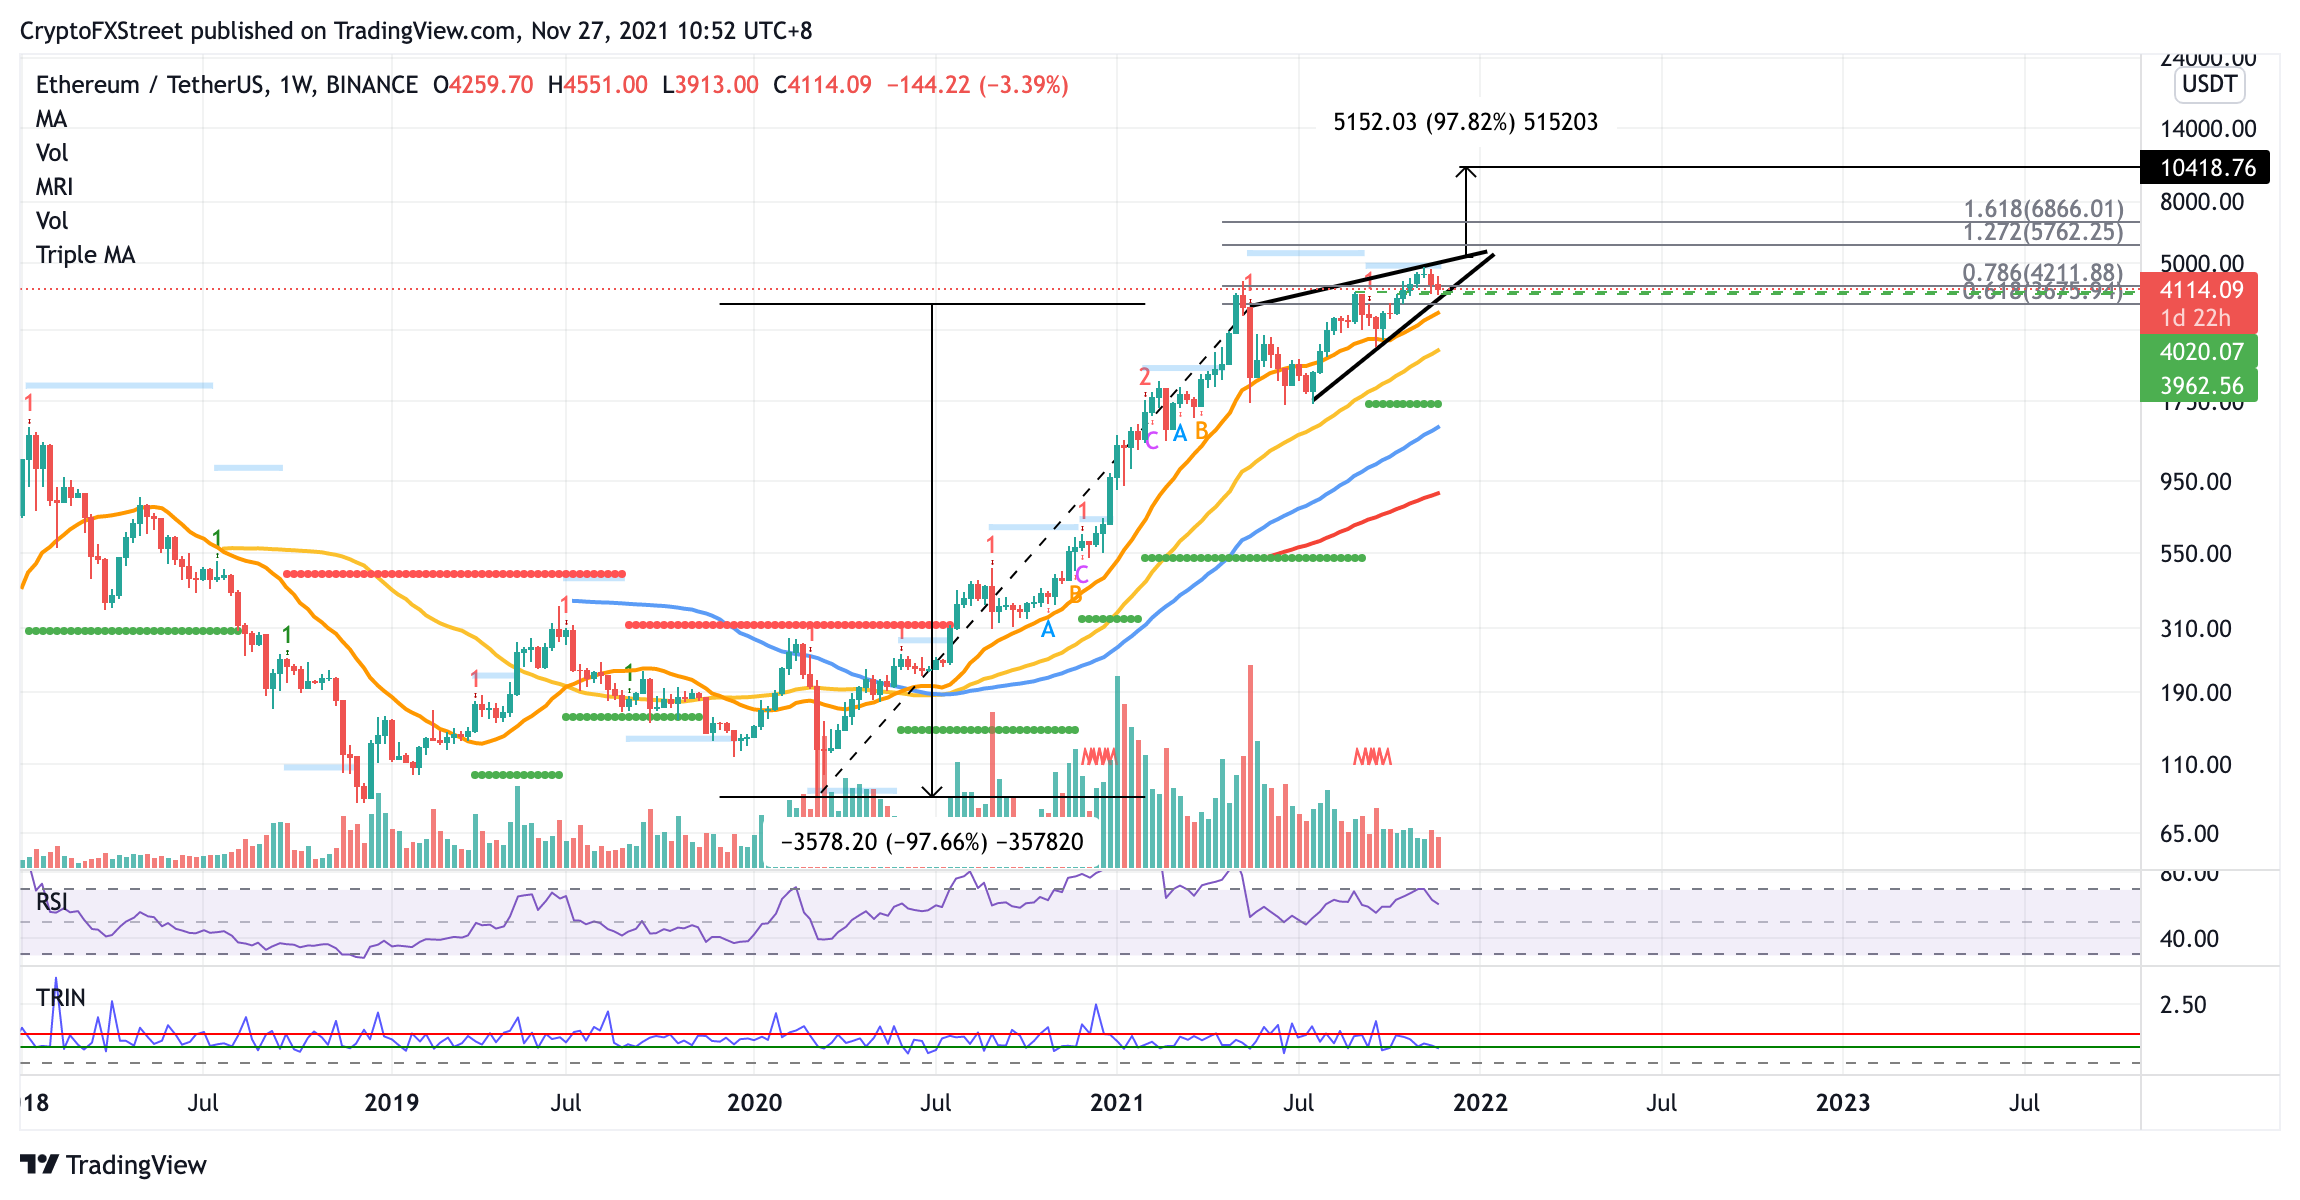
ETH/USDT weekly chart
The first area of resistance for Ethereum price appears to be at $4,211, where the 50-day Simple Moving Average (SMA) and the 78.6% Fibonacci retracement level coincide. Additional resistance will emerge at the 21-day SMA at $4,421.
The token’s all-time high at $4,884 will then act as an additional obstacle for Ethereum price, but slicing above this level could unravel further bullish intentions for ETH.
If Ethereum price manages to break above the aforementioned resistances, ETH may target the last remaining obstacle before the bullish outlook is validated, at the upper boundary of the bull pennant at $5,252. The 97% climb toward $10,418 would then be on the radar, but the token would be confronted by several hurdles, including the 127.2% Fibonacci extension level at $5,762, then at the 161.8% Fibonacci extension level at $6,866.
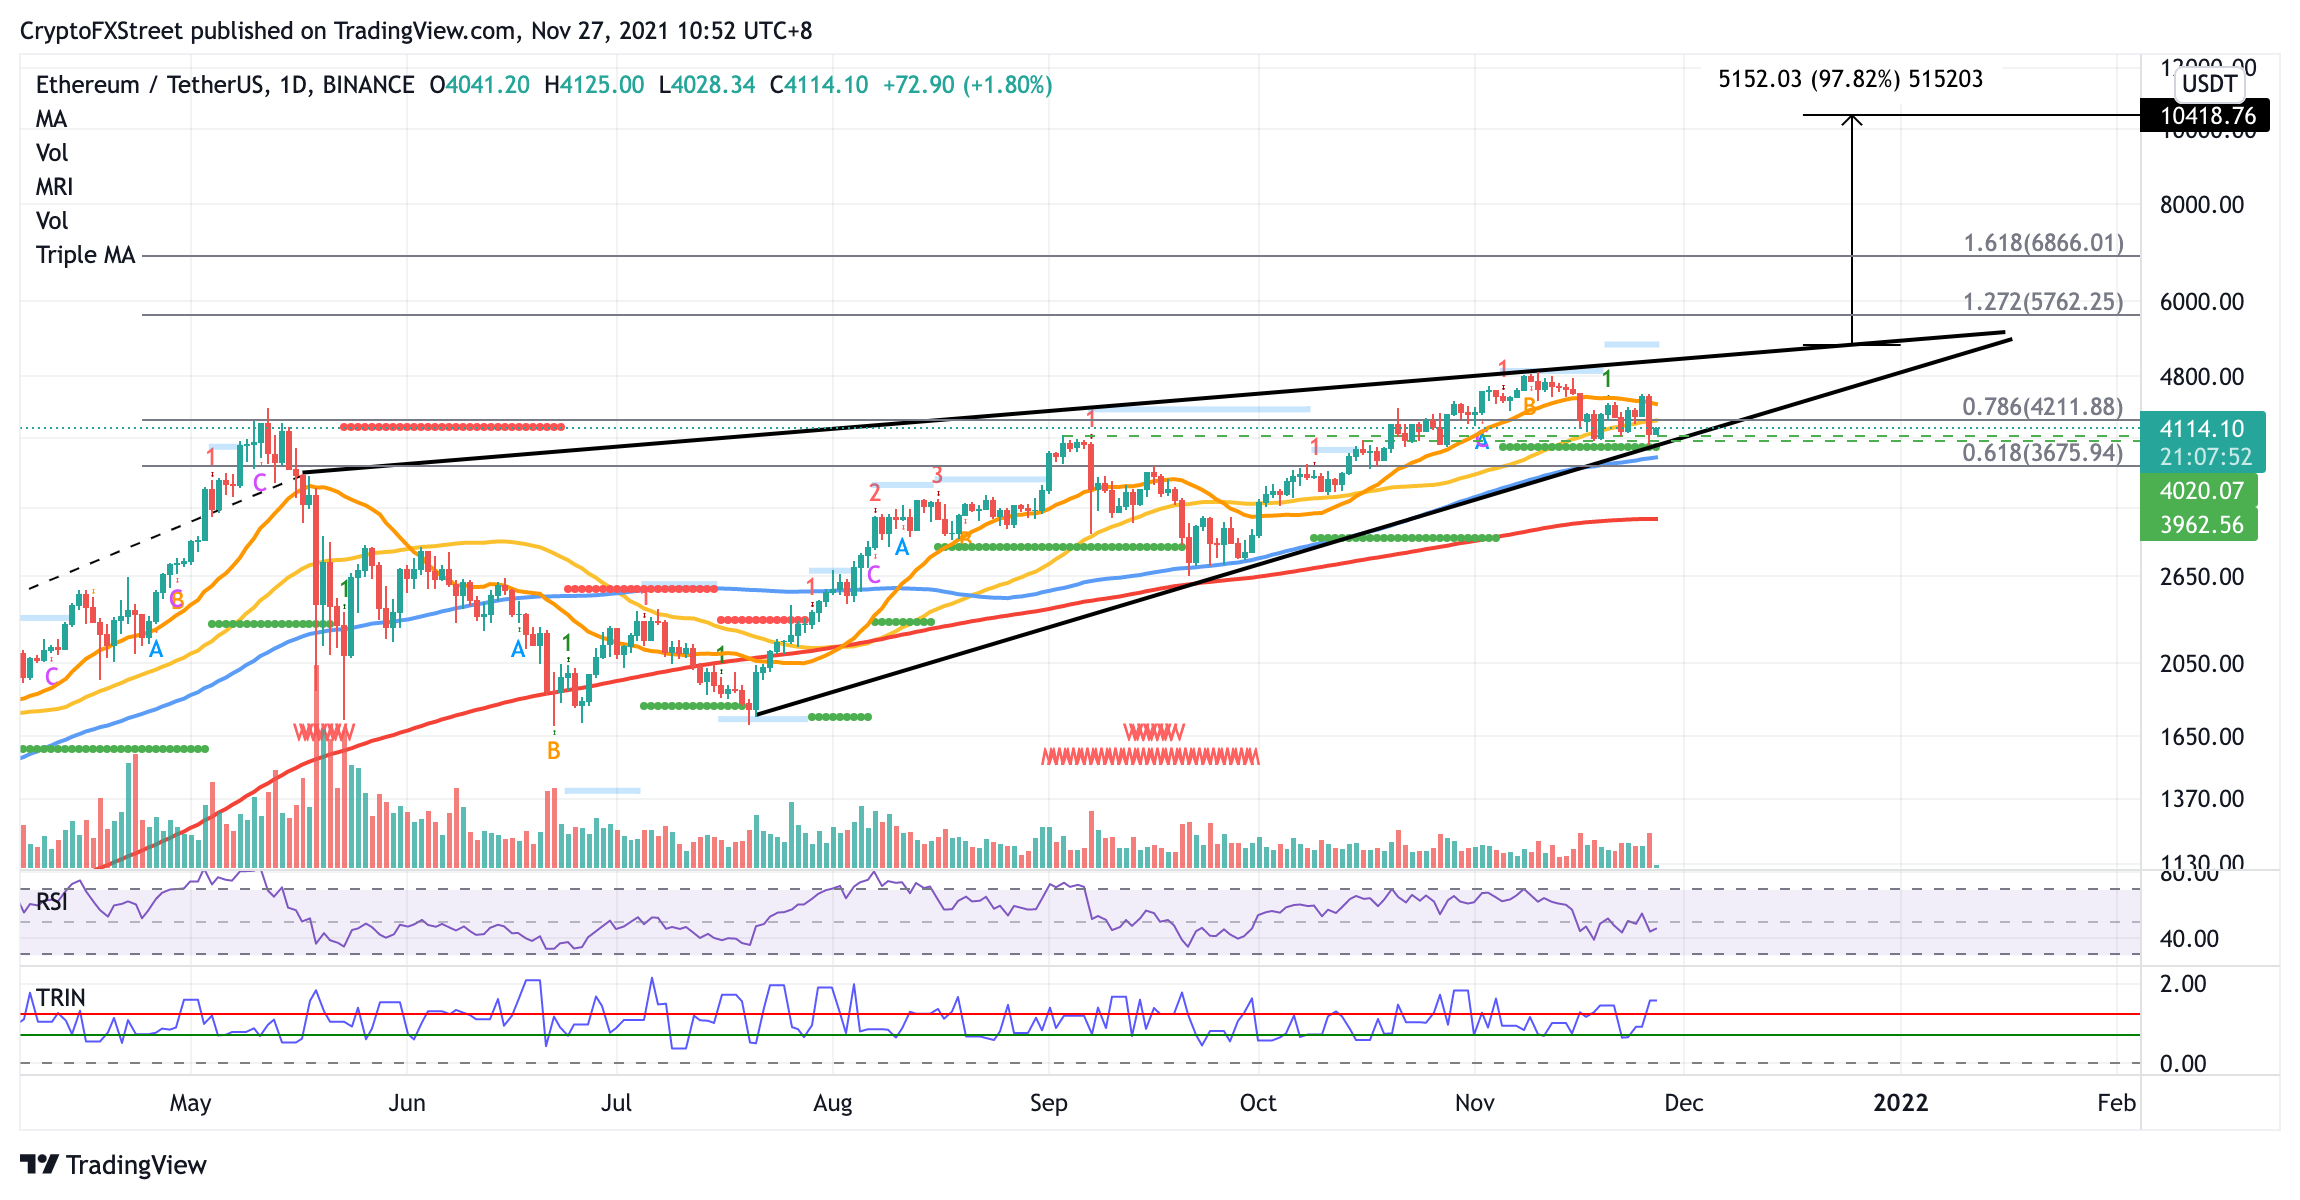
ETH/USDT daily chart
However, if Ethereum price faces profit-taking, ETH would discover the first line of defense at the September 3 high at $4,020, then at the October 16 high at $3,962. The lower boundary of the governing technical pattern at $3,917, coinciding with the support line given by the Momentum Reversal Indicator (MRI).
Investors should note that if Ethereum price slices below the aforementioned foothold, the bullish thesis may be invalidated and ETH could continue to slide lower, as it searches for reliable support at the 100-day SMA at $3,762, then at the 61.8% Fibonacci retracement level at $3,675.
Author

Sarah Tran
Independent Analyst
Sarah has closely followed the growth of blockchain technology and its adoption since 2016.


