Ethereum price analysis: Quick pattern formation, breakdown, target attained
- Ethereum price forms rising wedge pattern on short term charts.
- Breaks down and attains target quickly.

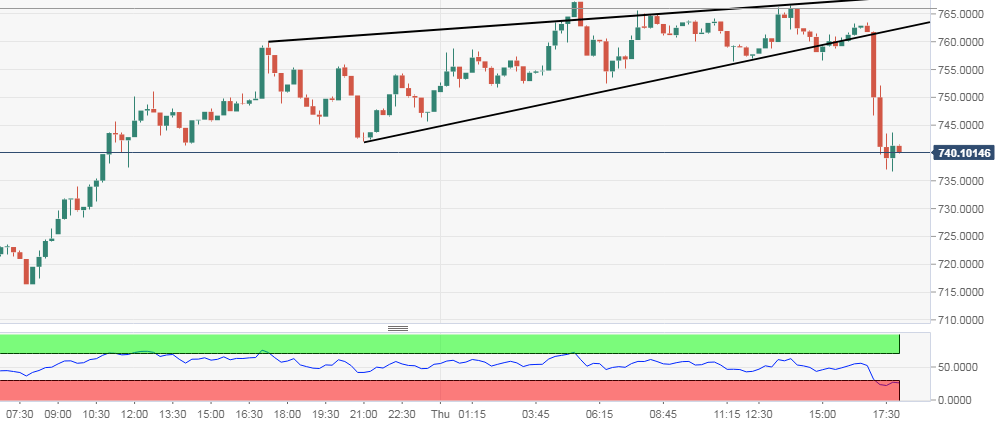
Ethereum price formed a falling wedge pattern on the short term charts, broke down of it quickly and attained the price target too, all in a quick time of less than a day - How rarely do we get to see that? Cryptocurrencies are known as wild animal of investing world for this very reason.
ETH/USD is trading more than 1 percent lower on day at $741.57 and more than 3 percent lower from day's high of $767.32. On 15-minute chart, ETH formed a rising wedge pattern, which is potentially bearish pattern. It took less than 24 hours for the pattern to form, price to break down and target to reach.
What this does to ETH is changes momentum into the favour of bears. Immediate support now for ETH is at $740 and $720 and resistance around the day's high, at $770. Key resistance for ETH is still the long term trendline at $800.
ETH/USD 15-minute chart:
Author

Manoj B Rawal
Independent Analyst
Manoj B Rawal, financial markets professional with about 11 years of experience in writing, editing and advising on stocks, currencies and fixed income.


