Ethereum price analysis: ETH/USD struggles to break past resistance at the SMA 20 curve
- ETH/USD has found resistance at both the SMA 20 and SMA 50 curves.
- 20-day Bollinger width has narrowed, indicating decreasing market volatility.

ETH/USD buoyed the price up slightly from $174.60 to $174.85 in the early hours of Tuesday. It looks like the bulls want to retake control of the market after the bears took over on Monday and brought ETH/USD down from $175.71 to $174.60. The hourly ETH/USD price chart shows us two significant price actions. Firstly, after steadily dropping to $174.27, the price spiked up to $177.25 in one hour. Just four hours later, the price plunged from $176.71 to $173.
ETH/USD daily chart
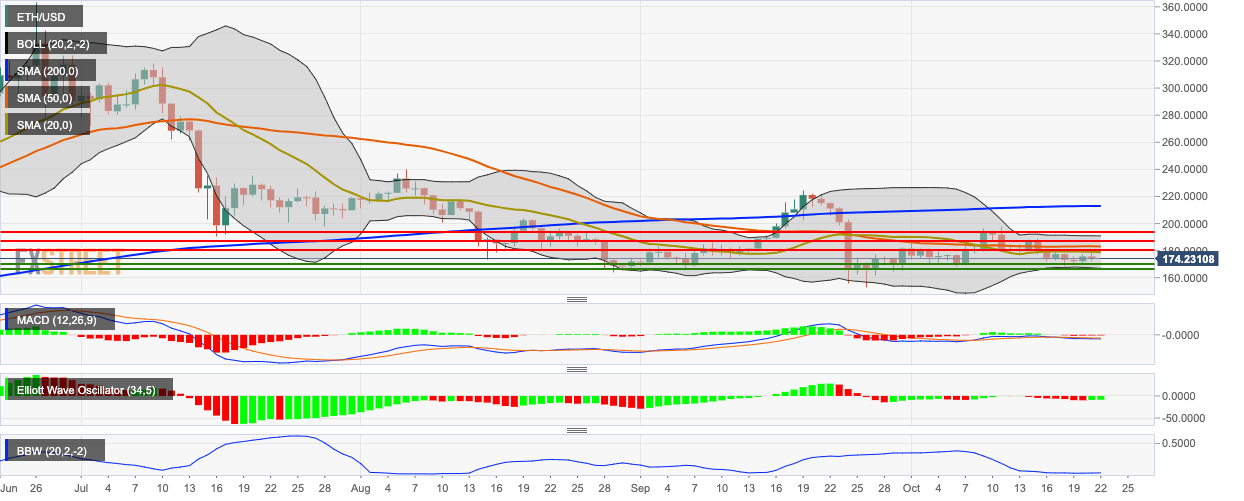
ETH/USD has to overcome resistance at the 20-day Simple Moving Average (SMA 20) and SMA 50 curves. The 20-day Bollinger band has narrowed significantly, which indicates decreasing market volatility. The Moving Average Convergence/Divergence (MACD) shows sustained bearish momentum, while the Elliott Oscillator has had two green sessions following seven consecutive red sessions.
Author

Rajarshi Mitra
Independent Analyst
Rajarshi entered the blockchain space in 2016. He is a blockchain researcher who has worked for Blockgeeks and has done research work for several ICOs. He gets regularly invited to give talks on the blockchain technology and cryptocurrencies.


