Ethereum price analysis: ETH/USD in turmoil unable to break $300 crucial level as Google adds ETH big data analysis
- Ethereum buyers have no choice but to attack $300 and find a higher support to avoid the frequent dips towards $280.
- Ethereum joins Bitcoin (BTC) on Google’s BigQuery big data analytics tool.

Ethereum buyers are getting sick of the selling pressure that has kept them languishing below the stubborn $300 crucial level for several weeks now. There was a step above this level last weekend but the bulls failed to sustain the uptrend resulting in a slide towards $280. The session yesterday saw a slight retracement above $290 but began trimming gains on reaching $292.
Significantly, Google has announced the addition of Ethereum (ETH) to its popular big data platform BigQuery. Google users are now able to access ETH data on BigQuery. Bitcoin (BTC) is already supported on the platform. The web services analysis colossal amounts of data in collaboration with Google Storage. In addition to that, it boasts of robust OLAP abilities that handle the analysis while eliminating the need to have extra API implementation. A section of the announcement reads:
“While the Ethereum blockchain peer-to-peer software has an API for a subset of commonly used random-access functions […], API endpoints don’t exist for easy access to all of the data stored on-chain.”
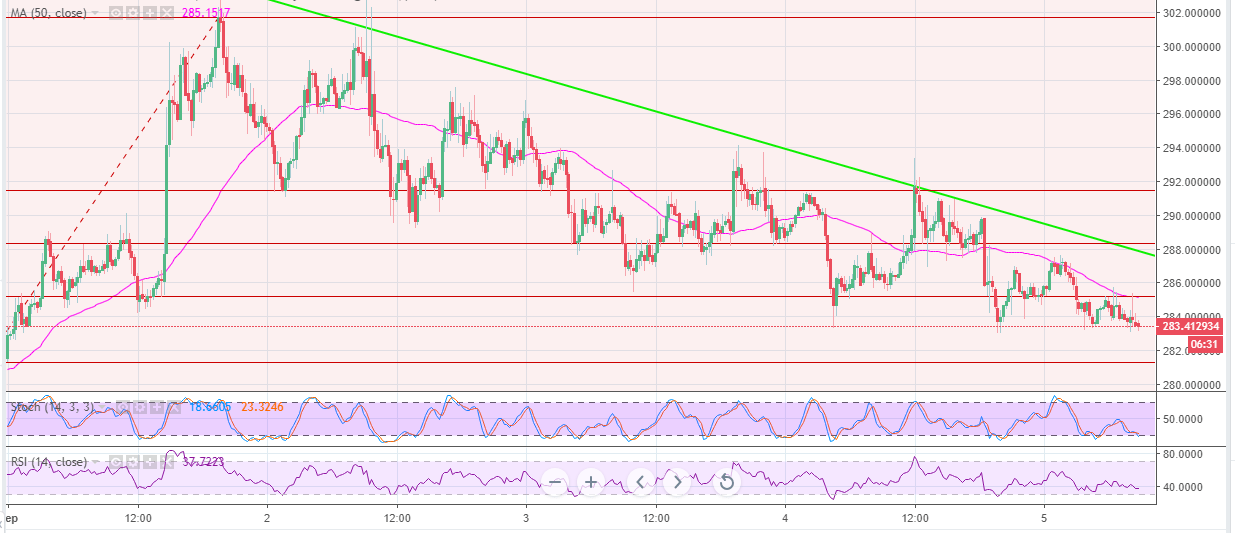
Meanwhile, Ethereum is trading below the 50SMA on the 15-minutes chart. The trend is generally bearish, besides technical signals are quite negative. Applying Fib levels places significant hurdles at the 23.6% Fibo between the highs of $301.68 and the lows of $274.98. A break above this level will encounter more resistance at $288 - $290 and $294. However, recoil above $300 will help the buyers to detangle from the selling pressure that keeps taking them back to the drawing board at $280.
ETH/USD 1-hour chart
Get 24/7 Crypto updates in our social media channels: Give us a follow at @FXSCrypto and our FXStreet Crypto Trading Telegram channel
Author

John Isige
FXStreet
John Isige is a seasoned cryptocurrency journalist and markets analyst committed to delivering high-quality, actionable insights tailored to traders, investors, and crypto enthusiasts. He enjoys deep dives into emerging Web3 tren




