Ethereum price analysis: ETH/USD dozes in a tight range after a sharp sell-off on Sunday
- ETH/USD bears managed to stay above $210 support.
- Strong resistance is created by $213-$215 area.

Ethereum, the second-largest cryptocurrency with the current market capitalization of $22.7 billion, is hovering above the critical $210,00 handle. The coin attempted a recovery towards $218.00, but the upside momentum faded away and pushed the coin inside a tight range. ETH/USD has been moving sideways during early Asian hours, in sync with the cryptocurrency market sentiments. At the time of writing, ETH/USD is changing hands at $211.40, mostly unchanged since the beginning of Monday.
Ethereum's technical picture
ETH/USD hit the intraday low at $208.85 on Wednesday and has been moving sideways ever since.
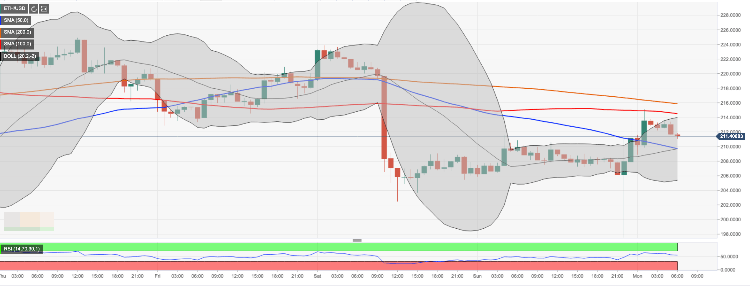
On the intraday timeframe, ETH/USD is initially supported by $209.60. This barrier is created by a confluence of SMA500 (Simple Moving Average) and the middle line of 1-hour Bollinger Band. Once it is out of the way, the sell-off is likely to gain traction with the next focus on $205.00 (the lower line of 1-hour Bollinger Band) followed by psychological $200.00. The recent low at $197.50 is likely to stop the sell-off.
On the upside, the initial resistance comes at $213.00-$215.00 area. This resistance zone contains the upper edge of 1-hour Bollinger Band, SMA100 and SMA200 (1-hour). We will need to see a sustainable move above this area for the upside to gain traction with the next focus on $220.00 followed by a combination of the upper line of 4-hour Bollinger Band and SMA 4-hour.
Considering that the intraday Relative Strength Index (RSI) stays flat in the neutral territory, which implies range-bound trading.
ETH/USD 1-hour chart
Author

Tanya Abrosimova
Independent Analyst


