Ethereum Price Analysis: ETH/USD deadly weekly evening star followed up with another bearish candle
- Ethereum price is trading in the red by 3.30% in the session on Friday.
- ETH/USD is running towards a complete reversal of 2020 gains.
- The price has been falling for two consecutive weeks, with no sign of respite.

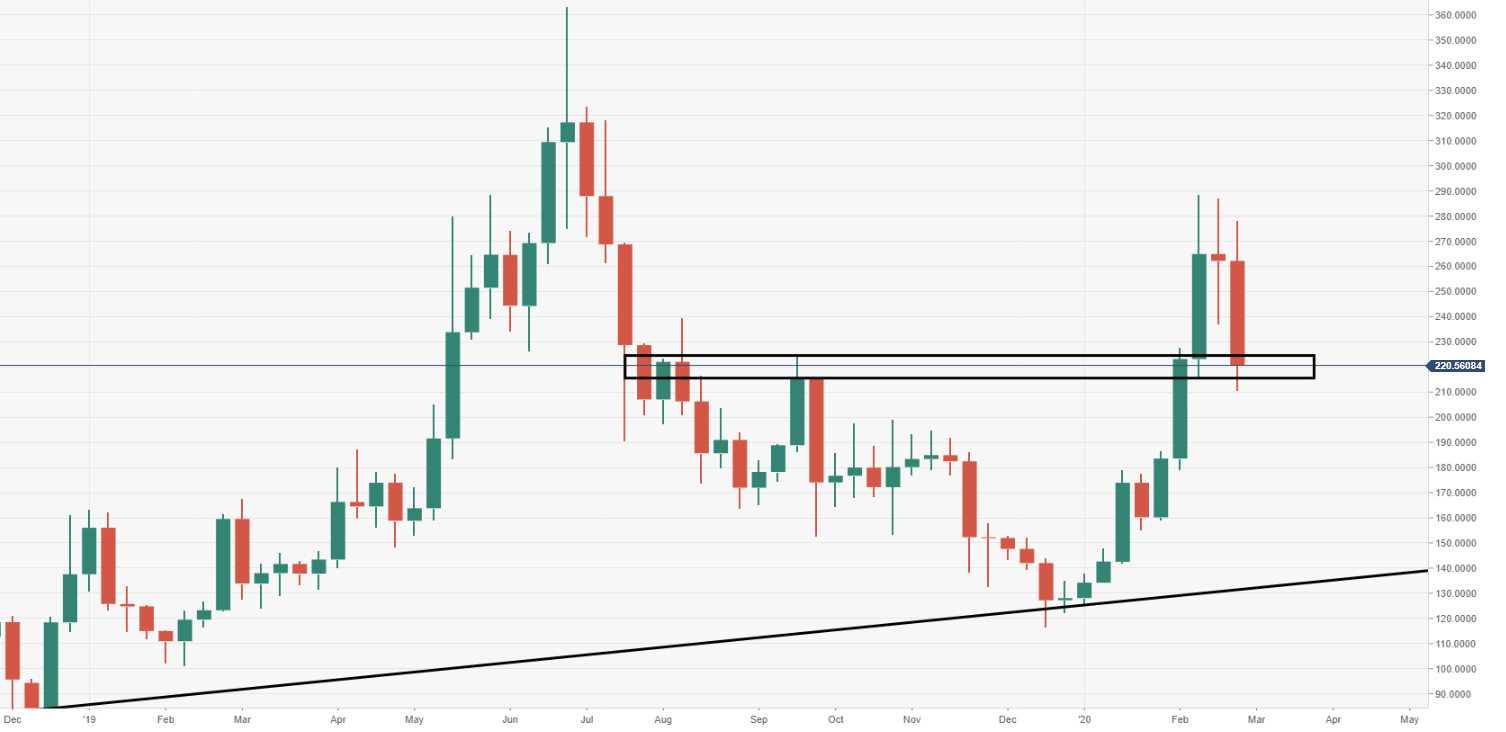
ETH/USD weekly chart
The next critical area of support is eyed down at the depressed levels of $140, where an ascending trend line can be observed.
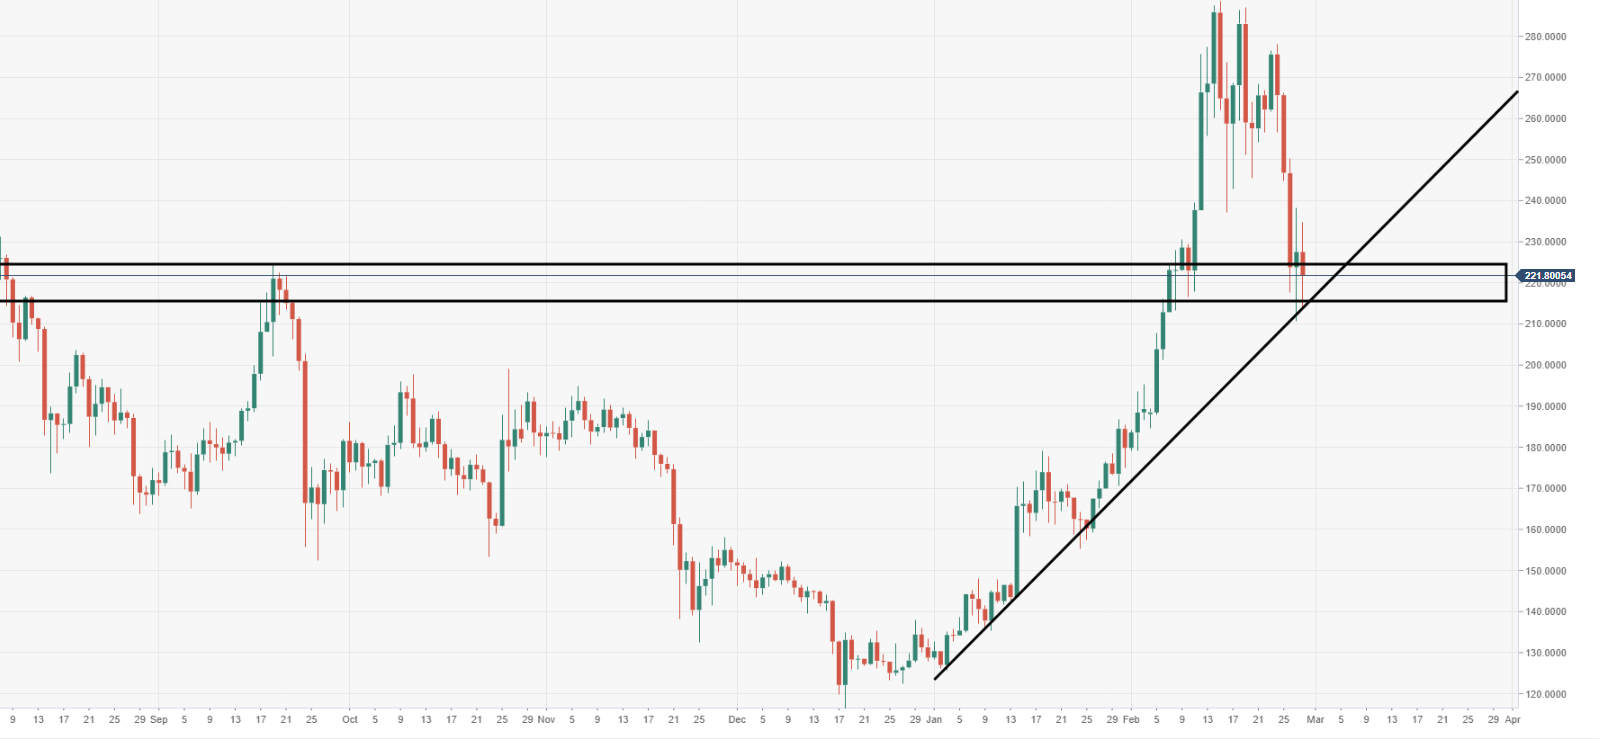
ETH/USD daily chart
A daily zone of support should be noted at the range of $230 - 210. Failure to hold could prove to be punishing, in forcing the price back down to the noted $140 weekly support.
Spot rate: 230.78
Relative change: -3.30%
High: 234.70
Low: 213.86
Author

Ken Chigbo
Independent Analyst
Ken has over 8 years exposure to the financial markets. He started his career as an analyst, covering a variety of asset classes; forex, fixed income, commodities and equities.
More from Ken Chigbo


