Ethereum Price Analysis: ETH/USD critical daily support being tested at $160
- Ethereum price is trading in the red by 0.60% in the session on Monday.
- The bulls have received a near-term knockback by supply within the $180 region.
- Should a break above of the noted be observed, then the next target area would likely be $200.

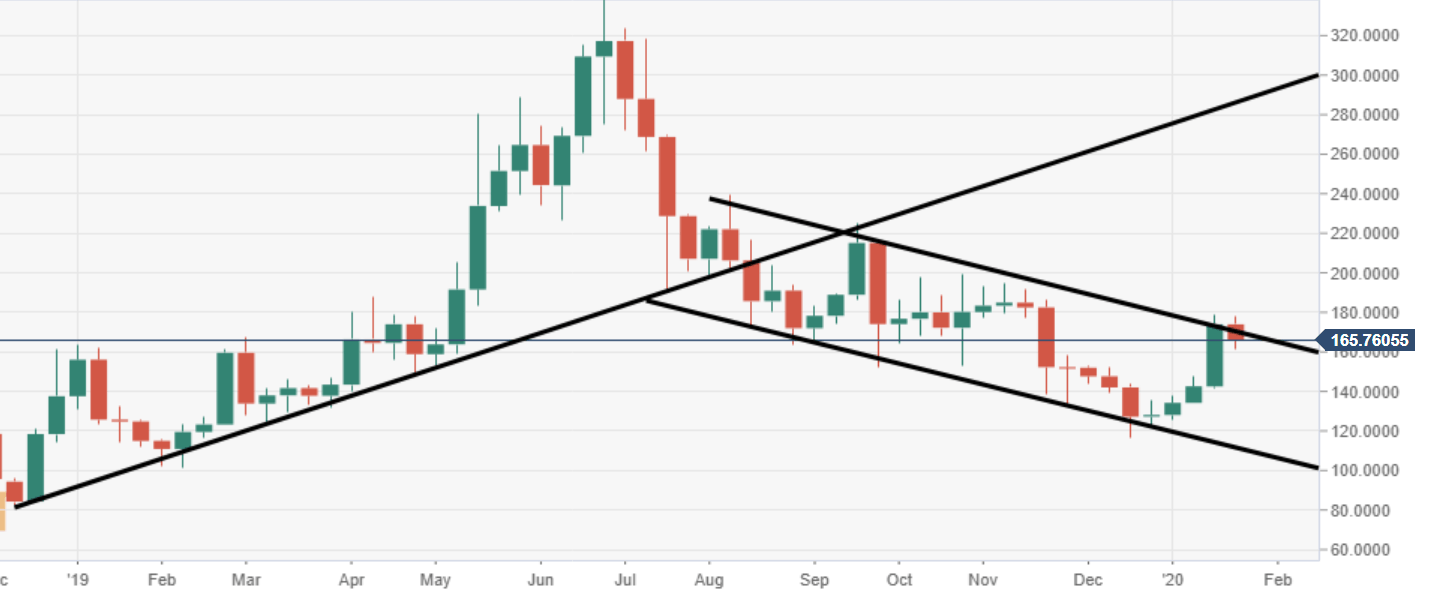
ETH/USD weekly chart
The price via the weekly managed to produce another closure in the green, running at four consecutive weeks.
ETH/USD daily chart
A descending trend line can be observed via the daily chart view, it can be seen capping price action at the momentum.
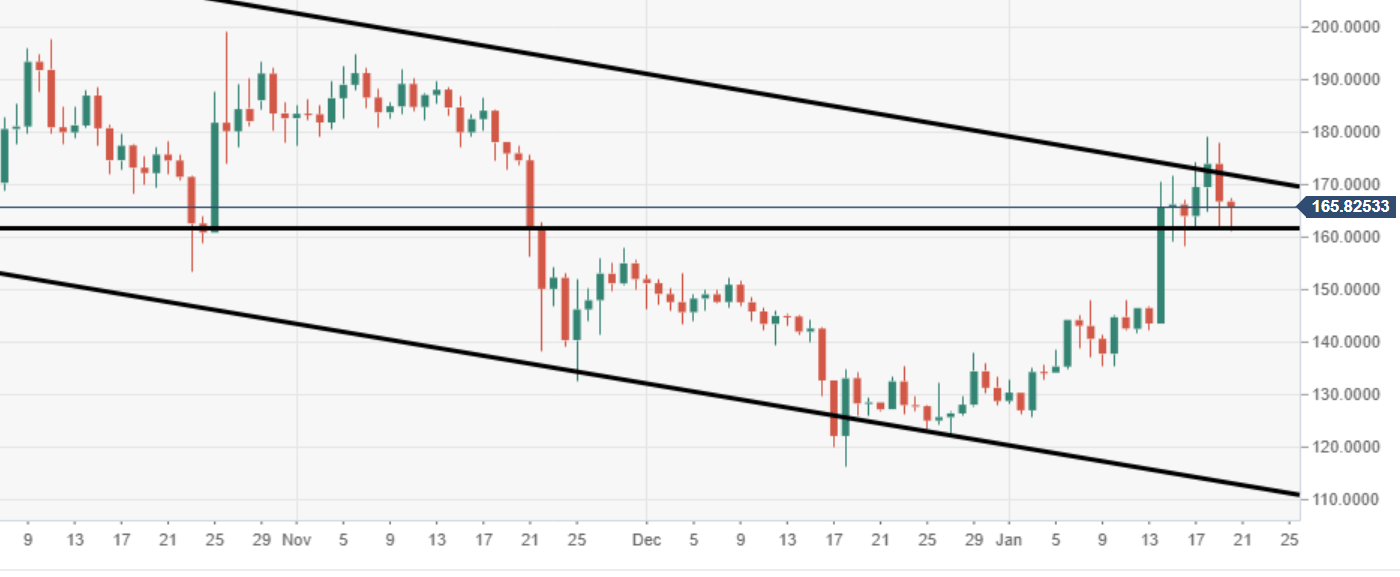
Spot rate: 165.86
Relative change: -0.60%
High: 167.28
Low: 161.11
Author

Ken Chigbo
Independent Analyst
Ken has over 8 years exposure to the financial markets. He started his career as an analyst, covering a variety of asset classes; forex, fixed income, commodities and equities.
More from Ken Chigbo


