Ethereum Price Analysis: ETH/USD big breakout looming
- Ethereum price is trading in the green by +2.30% in the session on Friday.
- The bulls are pressing for a breakout from a descending channel structure.
- In terms next major zone of support, this is seen from a range of $160-150.

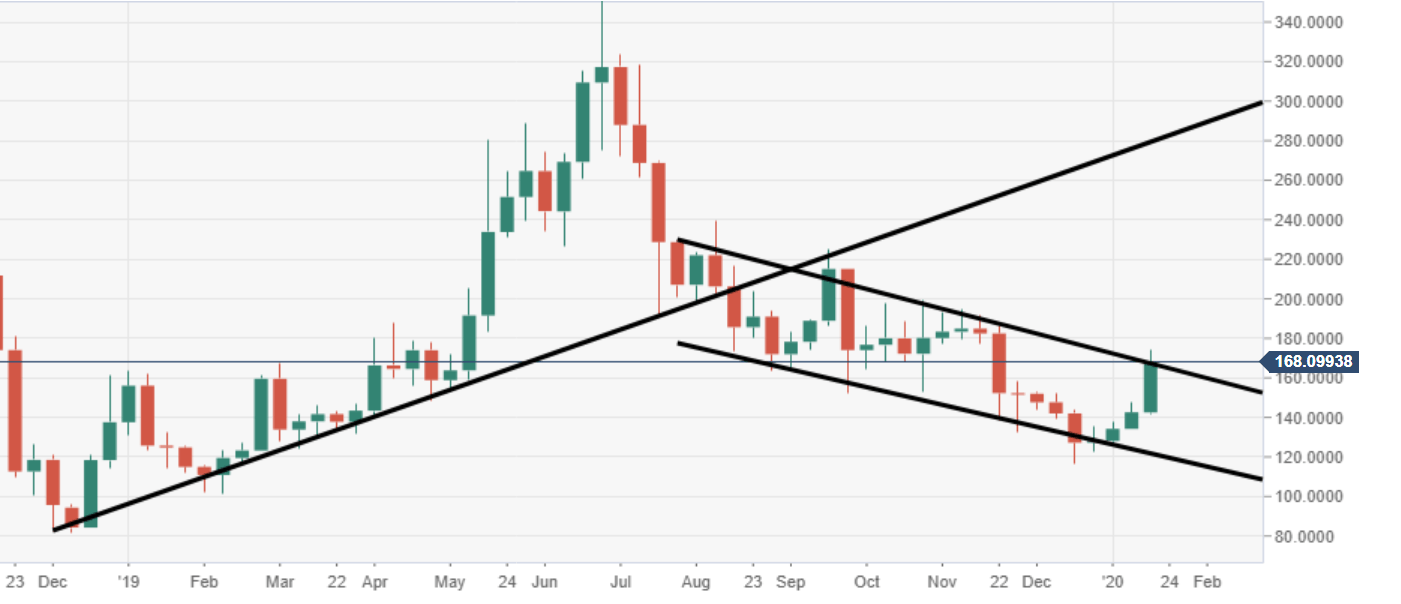
ETH/USD weekly chart
The price is running at its fourth consecutive week in the green, having jumped from $120 up to $175. Market bulls are attempting to breakout from a descending channel structure.
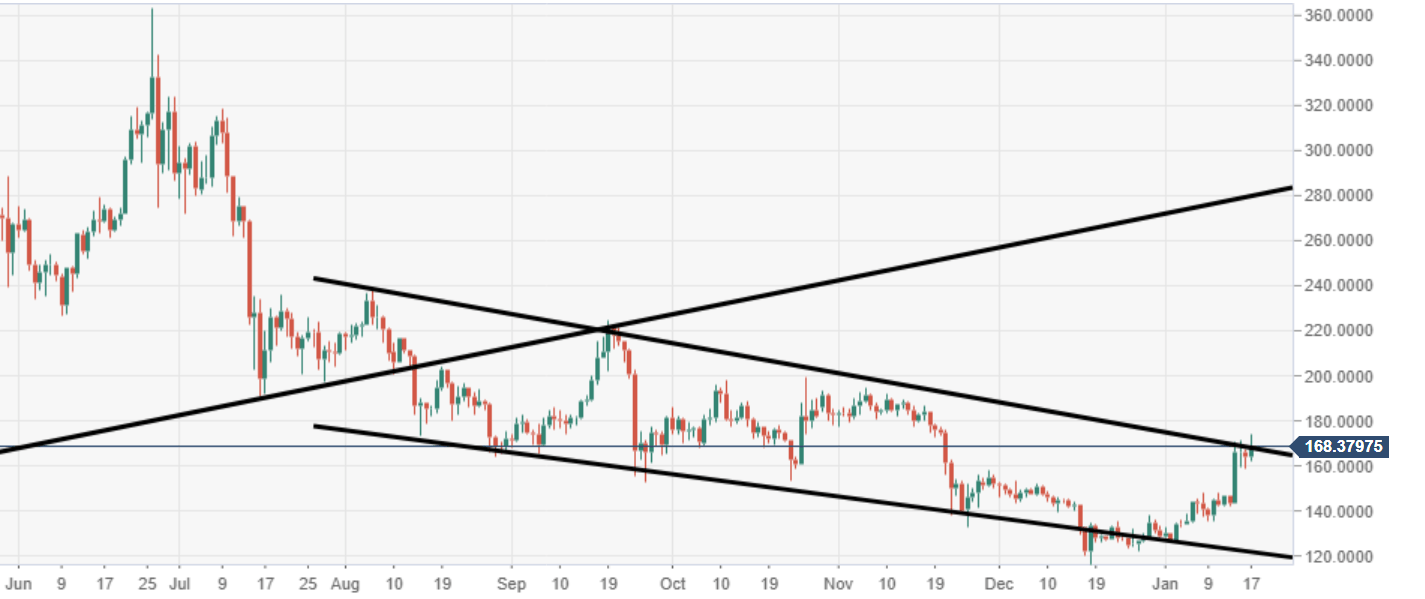
ETH/USD daily chart
Price action is flirting with the upper acting trend line of the channel, attempting to force a breach.
Spot rate: 161.19
Relative change: +2.30%
High: 174.22
Low: 162.08
Author

Ken Chigbo
Independent Analyst
Ken has over 8 years exposure to the financial markets. He started his career as an analyst, covering a variety of asset classes; forex, fixed income, commodities and equities.
More from Ken Chigbo


