Ethereum Price Analysis: ETH/USD at risk of a potential bear flag
- Ethereum price is trading in the red by 3.60% in the session on Friday.
- ETH/USD price action is flirting with the breached top area around $177-175.
- The bulls managed to push to the highest level since mid-November 2019.

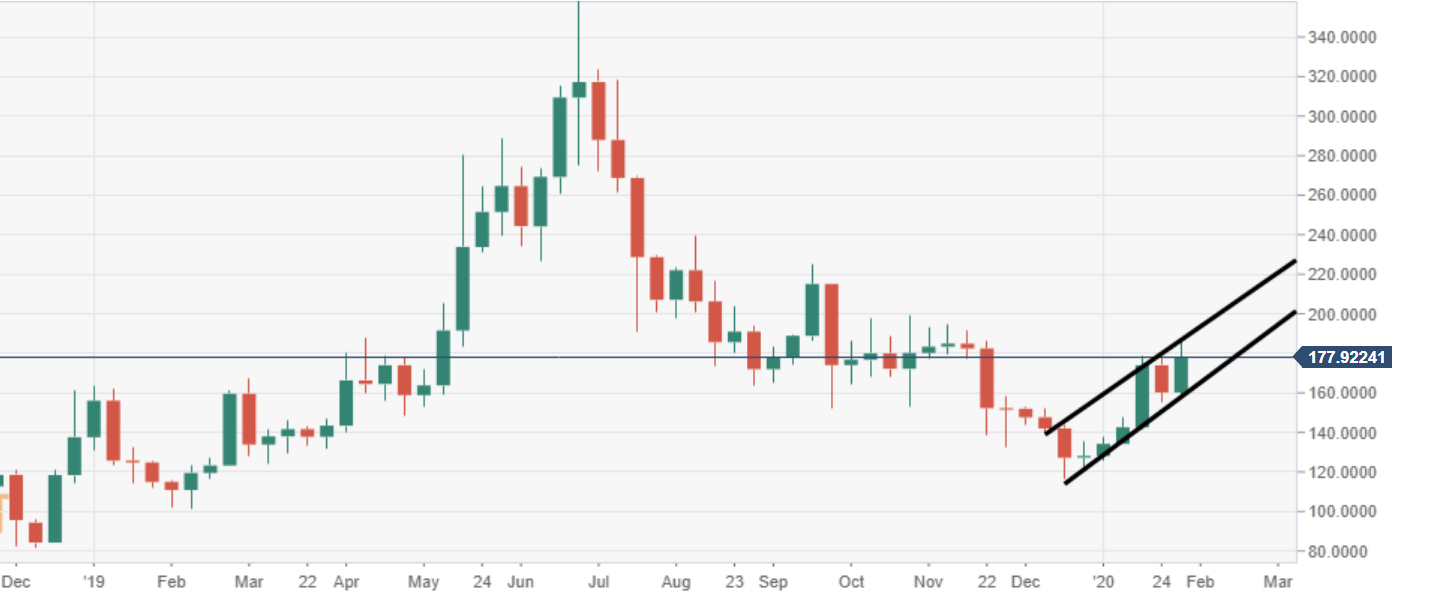
ETH/USD weekly chart
Price action is moving within an ascending channel structure via the weekly chart view, also viewable as a bearish flag.
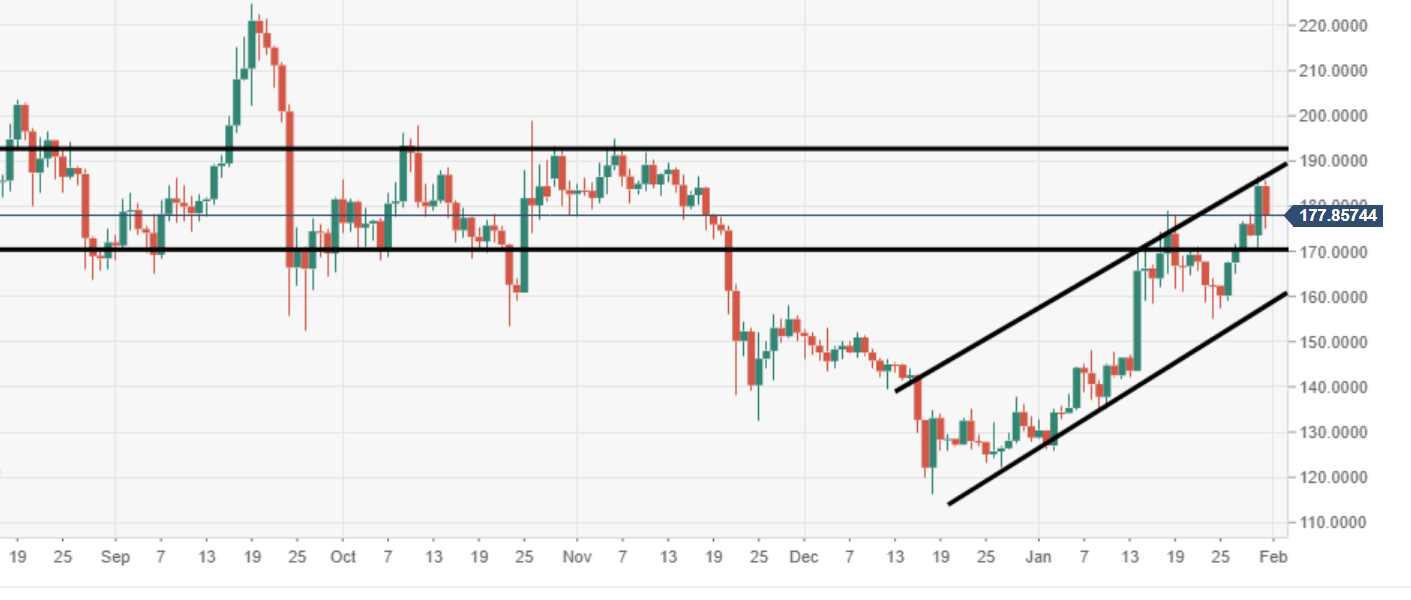
ETH/USD daily chart
A heavy amount of near-term supply should be noted at the range of $170-190 via the daily chart.
Spot rate: 177.80
Relative change: -3.60%
High: 185.49
Low: 175.05
Author

Ken Chigbo
Independent Analyst
Ken has over 8 years exposure to the financial markets. He started his career as an analyst, covering a variety of asset classes; forex, fixed income, commodities and equities.
More from Ken Chigbo


