Ethereum Price Analysis: ETH/USD approaches $155 support level
- ETH/USD went down from $169 to $160.75.
- The price is currently approaching the critical $155 support level.

ETH/USD went down from $169 to $160.75, charting a 4.88% drop this Monday. After failing at the $180 level, ETH/USD has been steadily falling over the past week. There have been consolidation attempts, but the overall sentiment has been bearish. This Monday, the price found support at the 20-day simple moving average (SMA 20) curve. If the bears breach past SMA 20 support, then they will be testing the critical support level at $155. On the upside, the resistance levels lie at $170, $175, and $180 levels.
ETH/USD Daily Chart
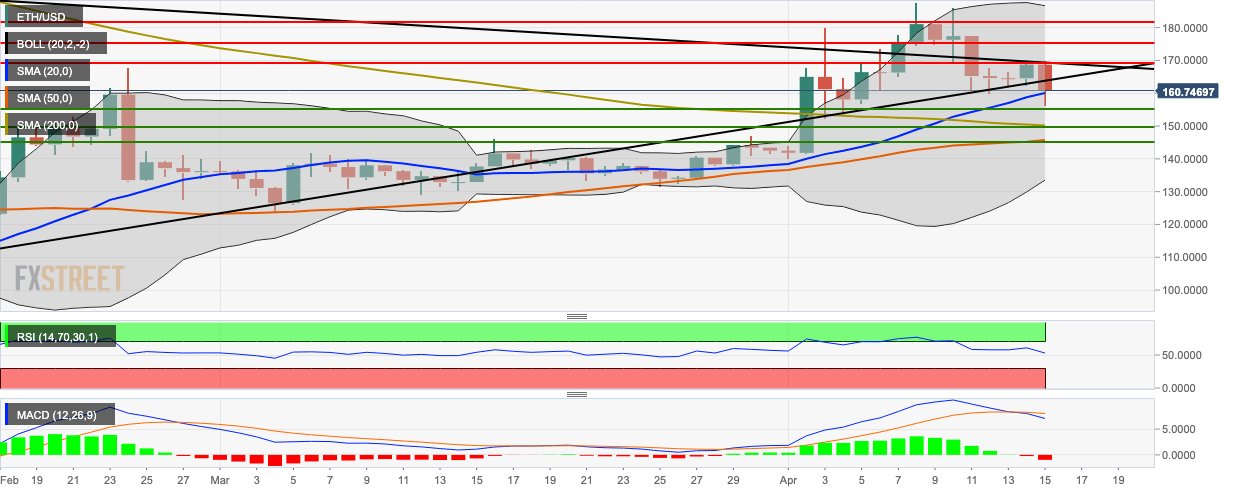
- The price has touched the SMA 20 curve and is above the SMA 200 and SMA 50 curves.
- The 20-day Bollinger band has narrowed, which shows decreasing market volatility.
- The Relative Strength Index (RSI) indicator is trending around 52.
- The signal line has diverged away from the moving average convergence divergence (MACD) line showing greater bearish momentum.
Author

Rajarshi Mitra
Independent Analyst
Rajarshi entered the blockchain space in 2016. He is a blockchain researcher who has worked for Blockgeeks and has done research work for several ICOs. He gets regularly invited to give talks on the blockchain technology and cryptocurrencies.


