Ethereum Price Analysis: ETH sellers ignore bounce off 50-day EMA to cheer short-term support break
- ETH/USD remains depressed while keeping downside break of five-week-old support line.
- Bearish MACD suggests another attempt to break 50-day EMA support.
- Monthly horizontal line adds to the upside barrier.

ETH/USD extends the previous day’s downside momentum to 574.11, down over 1.0%, during early Thursday. The crypto major took a U-turn from the horizontal area including an early-month high on Wednesday before declining below an ascending trend line from November 15. However, a 50-day EMA triggered the pair’s bounce that couldn’t last beyond 594.00.
Following that, ETH/USD drops back below the stated support line, now resistance, amid bearish MACD, which in turn suggests further weakness.
As a result, Ethereum sellers are targeting a 50-day EMA level of 550.88 by press time before eyeing the monthly low near 530.30.
During the quote’s further weakness past-530.30, the 500 threshold and late-November bottom around 480.00 will be in the spotlight.
On the flip side, a clear break above the immediate resistance line, previous support, at 585 now, needs to cross the horizontal area with an upper end of 638.50
In a case where the ETH/USD bulls manage to cross 638.50 on a daily closing basis, it should be a cakewalk for the optimists to refresh the monthly peak surrounding 677.00.
ETH/USD daily chart
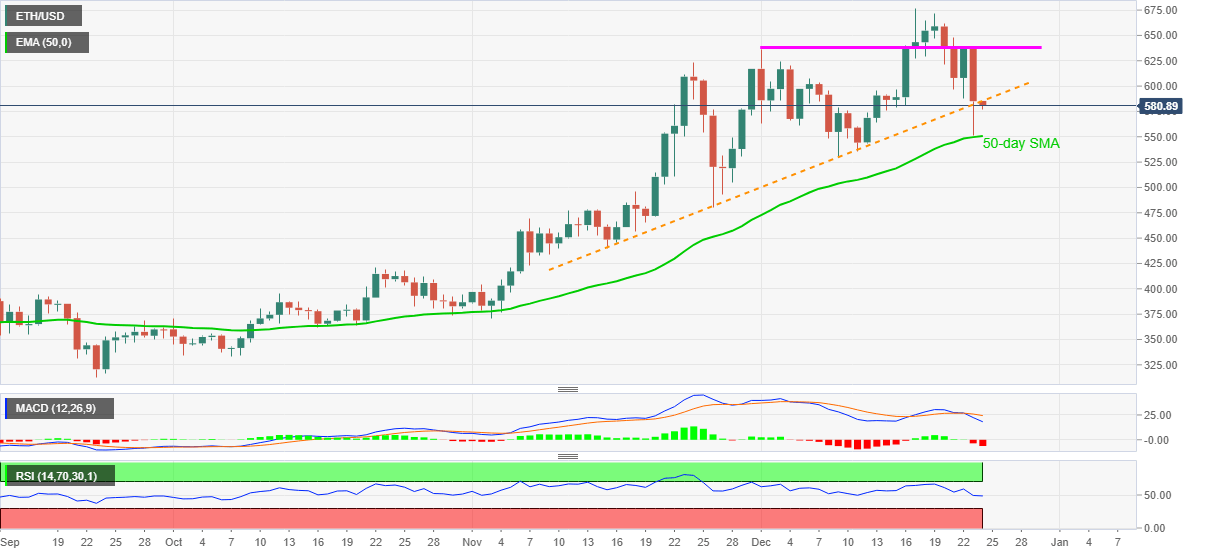
Trend: Bearish
Author

Anil Panchal
FXStreet
Anil Panchal has nearly 15 years of experience in tracking financial markets. With a keen interest in macroeconomics, Anil aptly tracks global news/updates and stays well-informed about the global financial moves and their implications.


