|

Ethereum Price Analysis: ETH eases ahead of the key hurdle to $2,000

  • ETH/USD snaps three-day winning streak, steps back from two-week top.
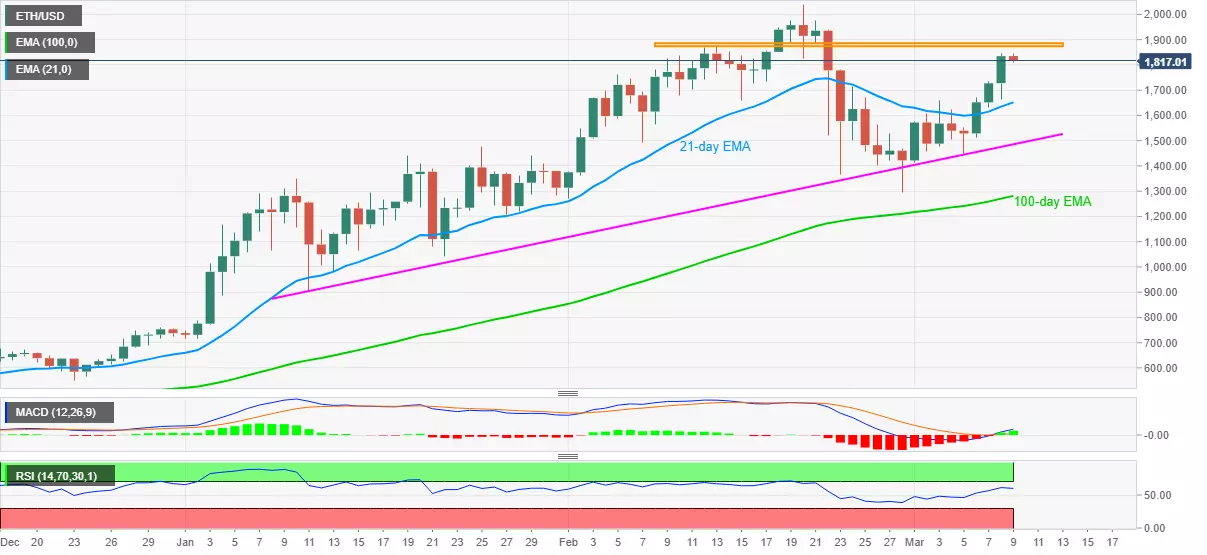
  • MACD, RSI stays in favor of the bulls, 21-day EMA tests pullback moves.
  • One-month-old horizontal area between $1,890 and $1,875 becomes the tough nut to crack for the buyers.

Ethereum consolidates recent gains around $1,820, declining for the first time in five days, during early Tuesday. In doing so, the altcoin takes a U-turn from the highest level since February 22, also declining before the key $1,890-75 resistance area.

Despite the recent pullback, ETH/USD bulls should remain hopeful amid upbeat RSI and MACD signals. However, the immediate downside towards the 21-day EMA level near $1,650 can’t be ruled out.

Should the Ethereum sellers dominate past-$1,650, a two-month-long rising support line close to $1,485 and 100-day EMA around $1,280 will be the key to watch.

On the flip side, a clear run-up beyond the stated $1,890 hurdle will be a clear signal for the ETH/USD bulls to retake the $2,000 round-figure.

Though, any further advances will need to stay beyond the latest record top of $2,041.

ETH/USD daily chart

Trend: Bullish

Additional important levels

Overview
Today last price1820.36
Today Daily Change-14.22
Today Daily Change %-0.78%
Today daily open1834.58
 
Trends
Daily SMA201665.14
Daily SMA501577.35
Daily SMA1001183.15
Daily SMA200794.19
 
Levels
Previous Daily High1843.99
Previous Daily Low1664.08
Previous Weekly High1657.91
Previous Weekly Low1292.76
Previous Monthly High2041.42
Previous Monthly Low1271.31
Daily Fibonacci 38.2%1775.26
Daily Fibonacci 61.8%1732.81
Daily Pivot Point S11717.78
Daily Pivot Point S21600.97
Daily Pivot Point S31537.87
Daily Pivot Point R11897.69
Daily Pivot Point R21960.79
Daily Pivot Point R32077.6

Author

Anil Panchal

Anil Panchal

FXStreet

Anil Panchal has nearly 15 years of experience in tracking financial markets. With a keen interest in macroeconomics, Anil aptly tracks global news/updates and stays well-informed about the global financial moves and their implications.

More from Anil Panchal
Share:

Editor's Picks

Grass 20% bullish breakout defies broader market weakness

Grass (GRASS) is edging up above $0.30 at the time of writing on Monday. The token’s notable 20% intraday surge stands out amid heightened volatility in the broader crypto market.

XRP slides as US-Iran war weakens sentiment

Ripple remains under pressure, trading around $1.35 at the time of writing on Monday. The remittance token extended its down leg to $1.27 on Saturday after the US, in collaboration with Israel, launched attacks on Iran, killing the nation’s Supreme Leader, Ali Khamenei.

Crypto Today: Bitcoin pares losses, Ethereum and XRP drift lower as Middle East conflict pressures risk assets

Bitcoin, Ethereum and Ripple remain on edge as the Israel-US war on Iran risk-off sentiment. The Crypto King trades above $66,000 at the time of writing on Monday, but is struggling to break through the seller congestion around $67,000.

Bitcoin on brink of breakdown amid US-Iran war

Bitcoin (BTC) remains under pressure near the key support level of $65,700. Trading at $66,400 at the time of writing on Monday, a breakdown below this critical level would suggest a deeper correction ahead.

Bitcoin Price Annual Forecast: BTC holds long-term bullish structure heading into 2026

Bitcoin (BTC) is wrapping up 2025 as one of its most eventful years, defined by unprecedented institutional participation, major regulatory developments, and extreme price volatility.

Bitcoin: Another month of losses, and it’s been five

Bitcoin (BTC) price is stabilizing around $68,000 at the time of writing on Friday, but the Crypto King is poised to close February on a fragile footing, marking its fifth consecutive month of losses since October and a rare start to the year with back-to-back monthly corrections.