Ethereum Price Analysis: ETH bulls cheer break of 17-week-old trend line above $700
- ETH/USD refreshes 31-month high after breaking the upside break of four-month-old resistance, now support.
- Bullish MACD, upbeat RSI and a sustained break of the key resistance line favor bulls.
- Sellers will have multiple downside barriers, starting from monthly support line, to watch.

ETH/USD takes the bids near $713.34 during the early Monday. In doing so, the Crypto major keeps an upside break of an ascending trend line from September 01 while probing the highest levels since May 2018.
Considering the pair’s successful trading above the previous resistance line, coupled with bullish MACD and upbeat RSI, not overbought, ETH/USD buyers have miles to go.
As a result, May 2018 peak surrounding $829 can lure the ETH/USD bulls. However, the $800 round-figure may offer an intermediate stop during the north-run.
It should, however, be noted that the quote’s upside past-$829 will be questioned by the RSI conditions, which if ignored could recall the February 2018 peak near $982 on the chart.
On the contrary, a downside break of the stated support line, previous resistance, around $678, will need to break the December 17 top of $677 and an upward sloping trend line from November 26, at $564.42 now, before retaking the controls.
During the ETH/USD selling past-$564, the 100-day SMA level of $472.00 will be in the spotlight.
Overall, ETH/USD is tracking the broad run-up in cryptocurrencies while eyeing the 2018 tops.
ETH/USD daily chart
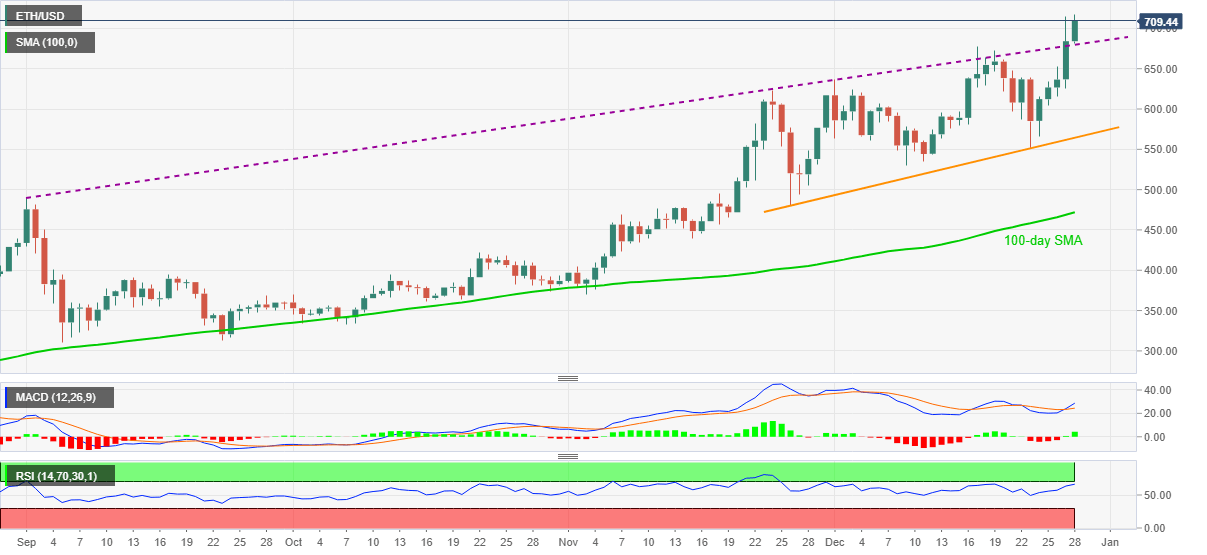
Trend: Bullish
Author

Anil Panchal
FXStreet
Anil Panchal has nearly 15 years of experience in tracking financial markets. With a keen interest in macroeconomics, Anil aptly tracks global news/updates and stays well-informed about the global financial moves and their implications.


