Ethereum (ETH/USD) has scope to correct further from Elliott Wave perspective [Video]
![Ethereum (ETH/USD) has scope to correct further from Elliott Wave perspective [Video]](https://editorial.fxstreet.com/images/Markets/Currencies/Digital Currencies/Ethereum/ethereum_3_XtraLarge.jpg)
Ethereum (ETHUSD) ended cycle from 3.10.2023 low with wave 1 at 2140.9 as the 1-hour chart below shows. The crypto-currency is now correcting cycle from 3.10.2023 low in wave 2. Internal subdivision of the pullback is unfolding as a zigzag Elliott Wave structure. Down from wave 1, wave (i) ended at 2053.1 and wave (ii) rally ended at 2123.6 The crypto extended lower in wave (iii) towards 1826 and wave (iv) ended at 1889.1. Final leg wave (v) lower ended at 1802.6 which completed wave ((a)). Ethereum then corrected in wave ((b)) towards 1963.2 with internal subdivision as another zigzag in lesser degree.
Ethereum (ETH/USD) 1-hour Elliott Wave chart
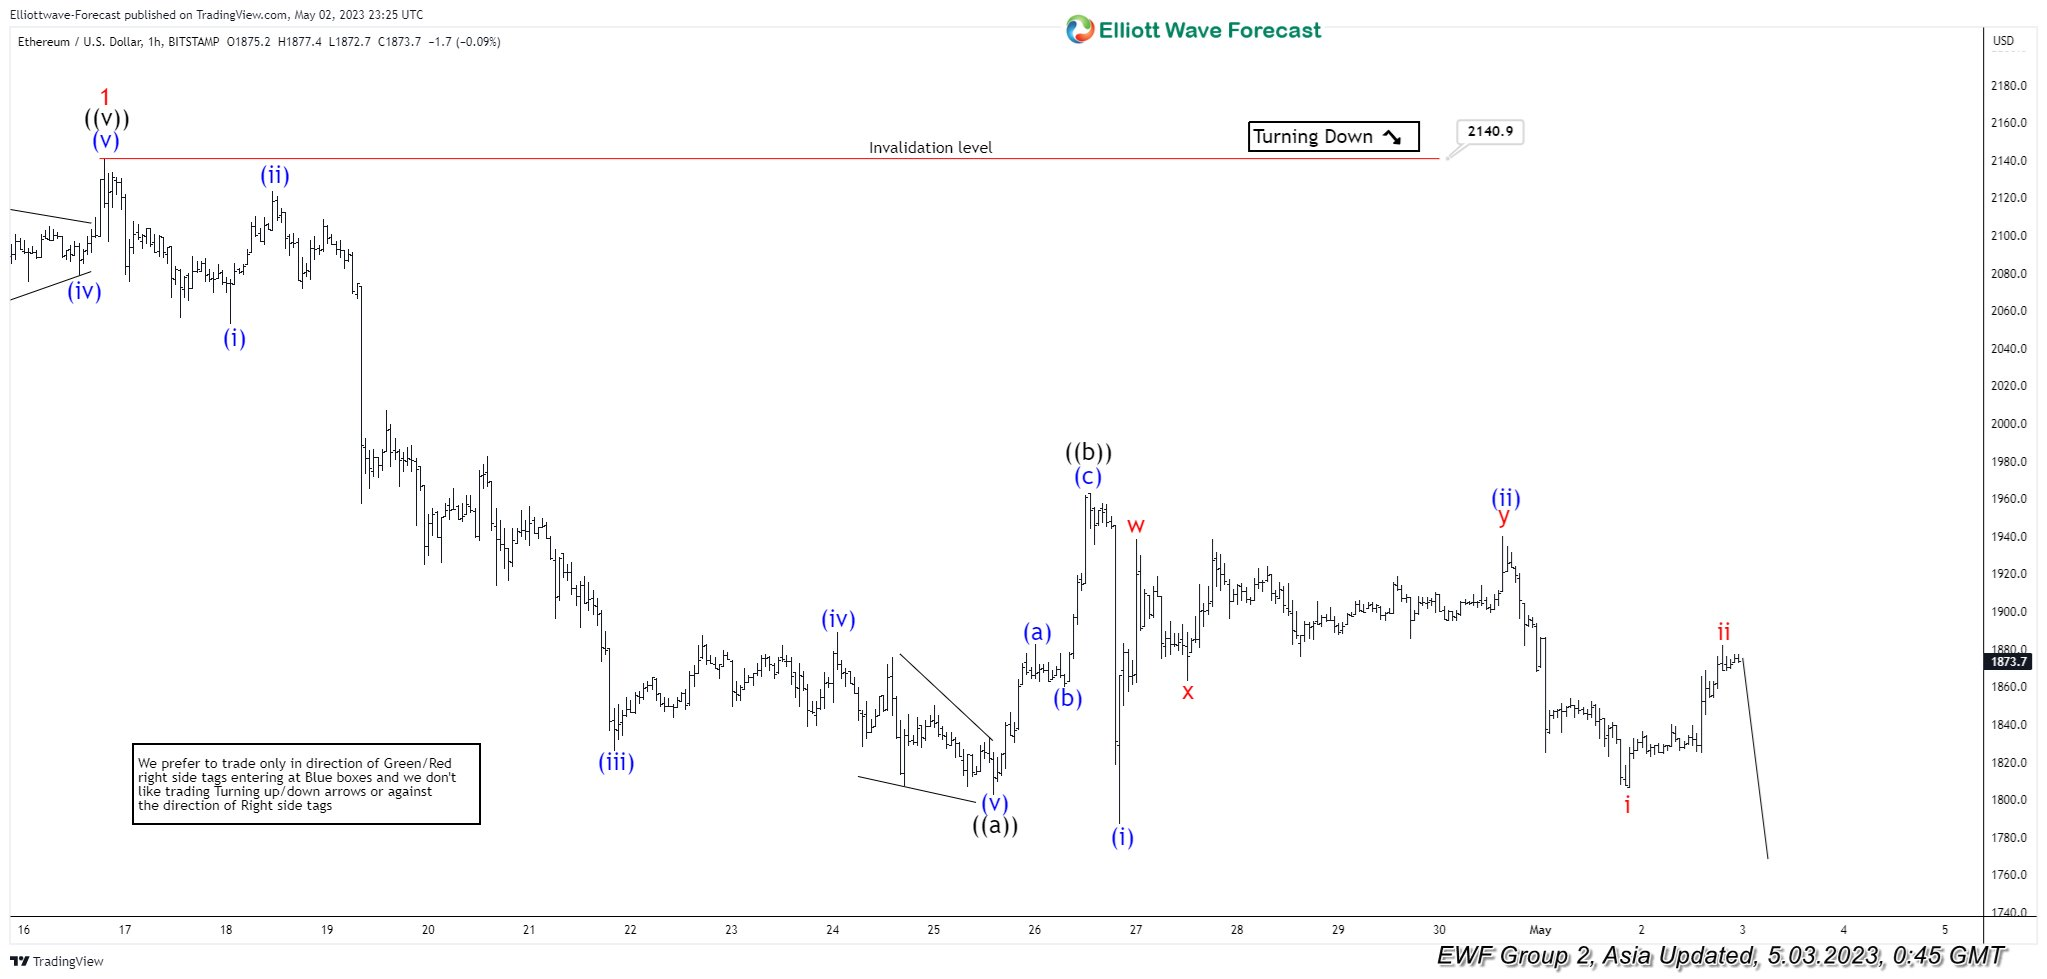
Up from wave ((a)), wave (a) ended at 1863.9 and pullback in wave (b) ended at 1859.7. Rally in wave (c) higher ended at 1963.2 which completed wave ((b)). The crypto has turned lower and broken below wave ((a)) at 1802.6. This confirms that the next leg lower wave ((c)) has started. Down from wave ((b)), wave (i) ended at 1787 and rally in wave (ii) ended at 1940. The crypto extends lower again in wave (iii). Down from wave (ii), wave i ended at 1806.1 and rally in wave ii ended at 1882.1. Near term, as far as pivot at 2140.9 high stays intact, expect rally to fail in 3, 7, 11 swing for further downside.
Ethereum (ETH/USD) Elliott Wave video
Author

Elliott Wave Forecast Team
ElliottWave-Forecast.com


