Ethereum Elliott Wave technical analysis [Video]
![Ethereum Elliott Wave technical analysis [Video]](https://editorial.fxsstatic.com/images/i/ETH-bearish-object_XtraLarge.png)
ETH/USD Elliott Wave technical analysis – Day chart
-
Function: Follow Trend.
-
Mode: Motive.
-
Structure: Impulse.
-
Position: Wave 2.
-
Direction next higher degrees: Not specified.
-
Wave cancel invalid level: Not specified.
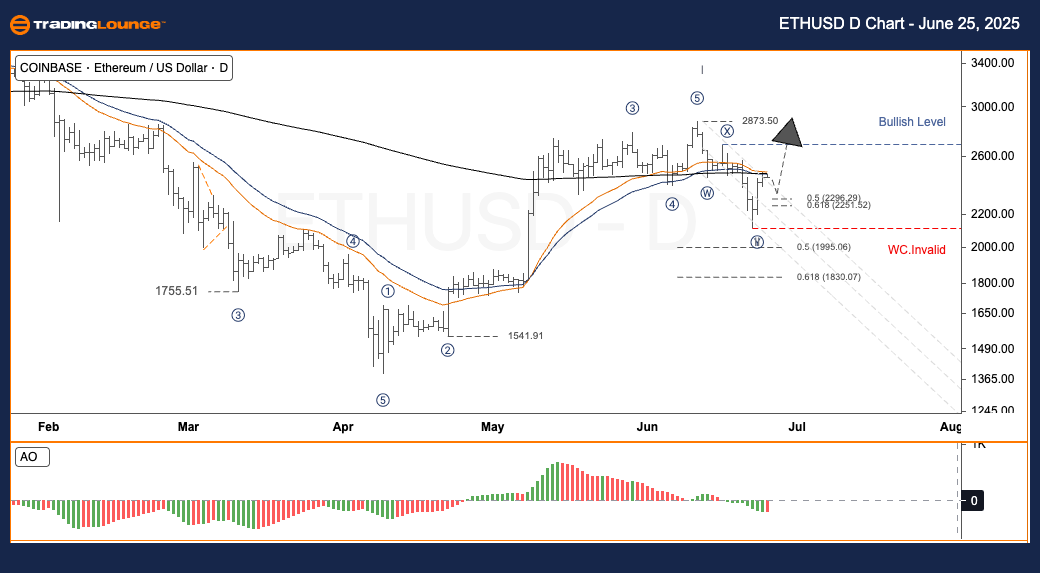
ETH/USD daily trading strategy
Ethereum (ETHUSD) recently completed its Wave II correction near a major support level. A bullish reversal signal marks the start of a new upward Wave (1) trend. Currently, the price has entered a minor Wave (2) consolidation. This sets the stage for Wave 3, potentially breaking through the $2,873 resistance level in the next advance.
Recommended trading strategy
-
For short-term traders (swing trade):
-
Look for buying opportunities as the price stabilizes within the Wave (2) sub-phase.
-
-
Risk Management: Place stop-loss orders below $2,116.
ETH/USD Elliott Wave Technical Analysis – Four-hour chart
-
Function: Follow Trend.
-
Mode: Motive.
-
Structure: Impulse.
-
Position: Wave 2.
-
Direction next higher degrees: Not specified.
-
Wave cancel invalid level: Not specified.
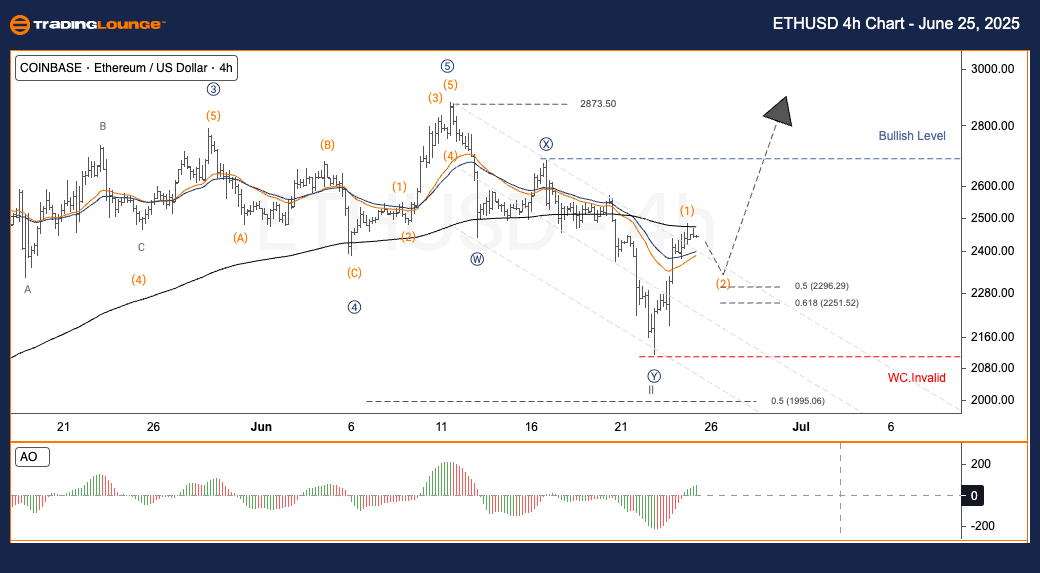
ETH/USD four-hour trading strategy
Ethereum (ETHUSD) has finished its Wave II correction at a critical support zone and is showing signs of a bullish breakout into Wave (1). Currently, the market is retracing within a minor Wave (2) pullback, setting up for an upward extension toward Wave 3 with potential to move above $2,873.
Recommended trading strategy
-
For short-term traders (swing trade):
-
Watch for entry setups during the Wave (2) consolidation.
-
Risk management: Implement stop-loss protection under $2,116.
-
-
Ethereum Elliott Wave technical analysis [Video]
Author

Peter Mathers
TradingLounge
Peter Mathers started actively trading in 1982. He began his career at Hoei and Shoin, a Japanese futures trading company.


