Ethereum Elliott Wave technical analysis [Video]
![Ethereum Elliott Wave technical analysis [Video]](https://editorial.fxstreet.com/images/Markets/Currencies/Digital Currencies/Ethereum/ethereum_2.jpg)
Elliott Wave Analysis TradingLounge.
Ethereum/ U.S. dollar(ETHUSD).
ETH/USD Elliott Wave technical analysis
Function: Counter Trend
Mode: Corrective
Structure: Zigzag
Position: Wave C
Direction next higher degrees: Wave II
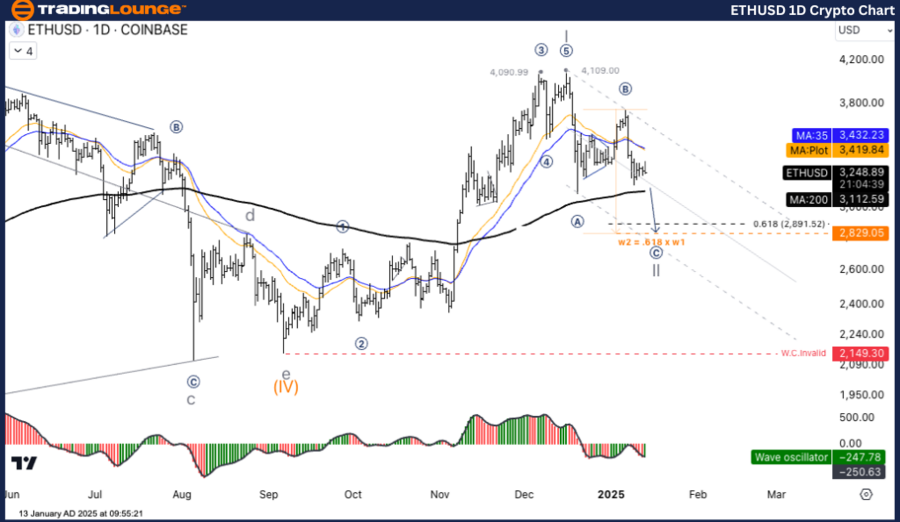
Details: ETH appears to be in the final stages of Wave II, which is subdividing into an “ABC” correction. Wave (C) is in progress, with a potential downside target near the 0.618 Fibonacci retracement level ($2,891.52).
Ethereum/ U.S. dollar (ETHUSD) Trading Strategy: ETH is likely heading toward the $2,891–$2,829 support zone to complete its Wave II correction. A reversal in this area would indicate the start of Wave III and a resumption of the bullish trend.
Holding above $2,891 is critical to maintaining the integrity of the wave structure and avoiding an extended correction. A break above $3,600 would confirm the end of the correction and the start of a new impulsive wave.
ETH/USD Elliott Wave technical analysis
Function: Counter Trend.
Mode: Corrective.
Structure: Zigzag.
Position: Wave C.
Direction next higher degrees: Wave II.
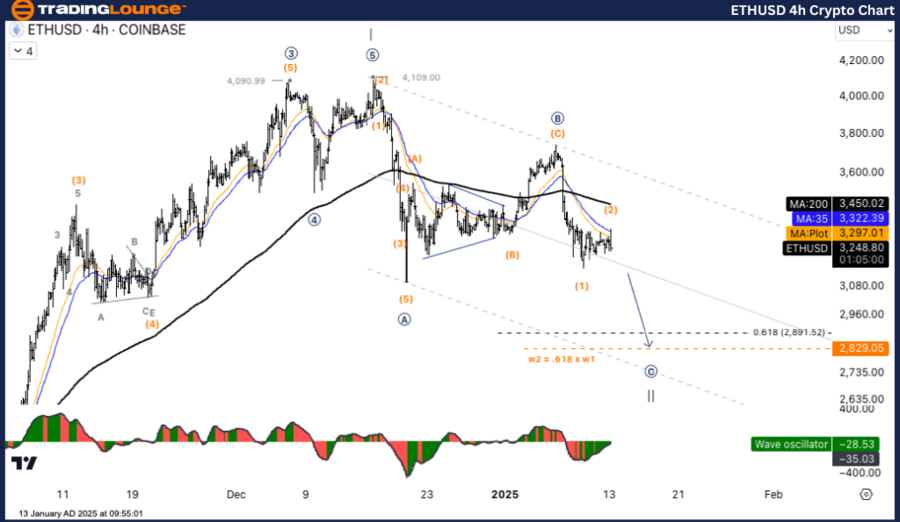
Details: ETH appears to be in the final stages of Wave II, which is subdividing into an “ABC” correction. Wave (C) is in progress, with a potential downside target near the 0.618 Fibonacci retracement level ($2,891.52).
Ethereum/ U.S. dollar (ETHUSD) Trading Strategy: ETH is likely heading toward the $2,891–$2,829 support zone to complete its Wave II correction. A reversal in this area would indicate the start of Wave III and a resumption of the bullish trend.
Holding above $2,891 is critical to maintaining the integrity of the wave structure and avoiding an extended correction. A break above $3,600 would confirm theend of the correction and the start of a new impulsive wave.
Ethereum Elliott Wave technical analysis [Video]
Author

Peter Mathers
TradingLounge
Peter Mathers started actively trading in 1982. He began his career at Hoei and Shoin, a Japanese futures trading company.



