Ethereum could trigger panic selling as ETH positions for a drop to $1,825
- Ethereum price is currently below two critical patterns, indicating an imminent sell-off.
- The $2,500 value area is the last support structure before ETH revisits and exceeds the 2022 lows.
- Unless bulls generate a surprise buying spree, another 30% drop is likely to occur.

Ethereum price is trading against its final support level at $2,500. The level is below the new 2022 Volume Point of Control and below a bearish continuation pattern. A huge sell-off looks very likely to occur at any moment.
Ethereum price hangs by a thread before capitulating down to $1,825
Ethereum price has two very bearish conditions on its daily Ichimoku chart. The first is the confirmation of an Ideal Bearish Ichimoku Breakout. The close on Friday confirmed this Ichimoku entry, and nothing has changed to invalidate it. The second bearish condition is the breakout below a bearish pennant.
Ethereum price is currently trading just a hair below the bottom trendline of a bearish pennant. Pennant patterns are triangles, in ETH’s case, a symmetrical triangle. To confirm a bearish breakout below the pennant, ETH needs to close at or below $2,500 – which is right where Ethereum was previously halted from further downside movement last week.
While current technicals show Ethereum price is clearly in bearish territory, some bullish signals have developed. The first is the continued support found at the 61.8% Fibonacci retracement in the $2,500 value area. Perhaps most important is shifting the 2022 Volume Point Of Control to $2,600, lending ETH some further support. However, Point Of Controls that move lower often signify broader weakness and can easily turn into strong future resistance.
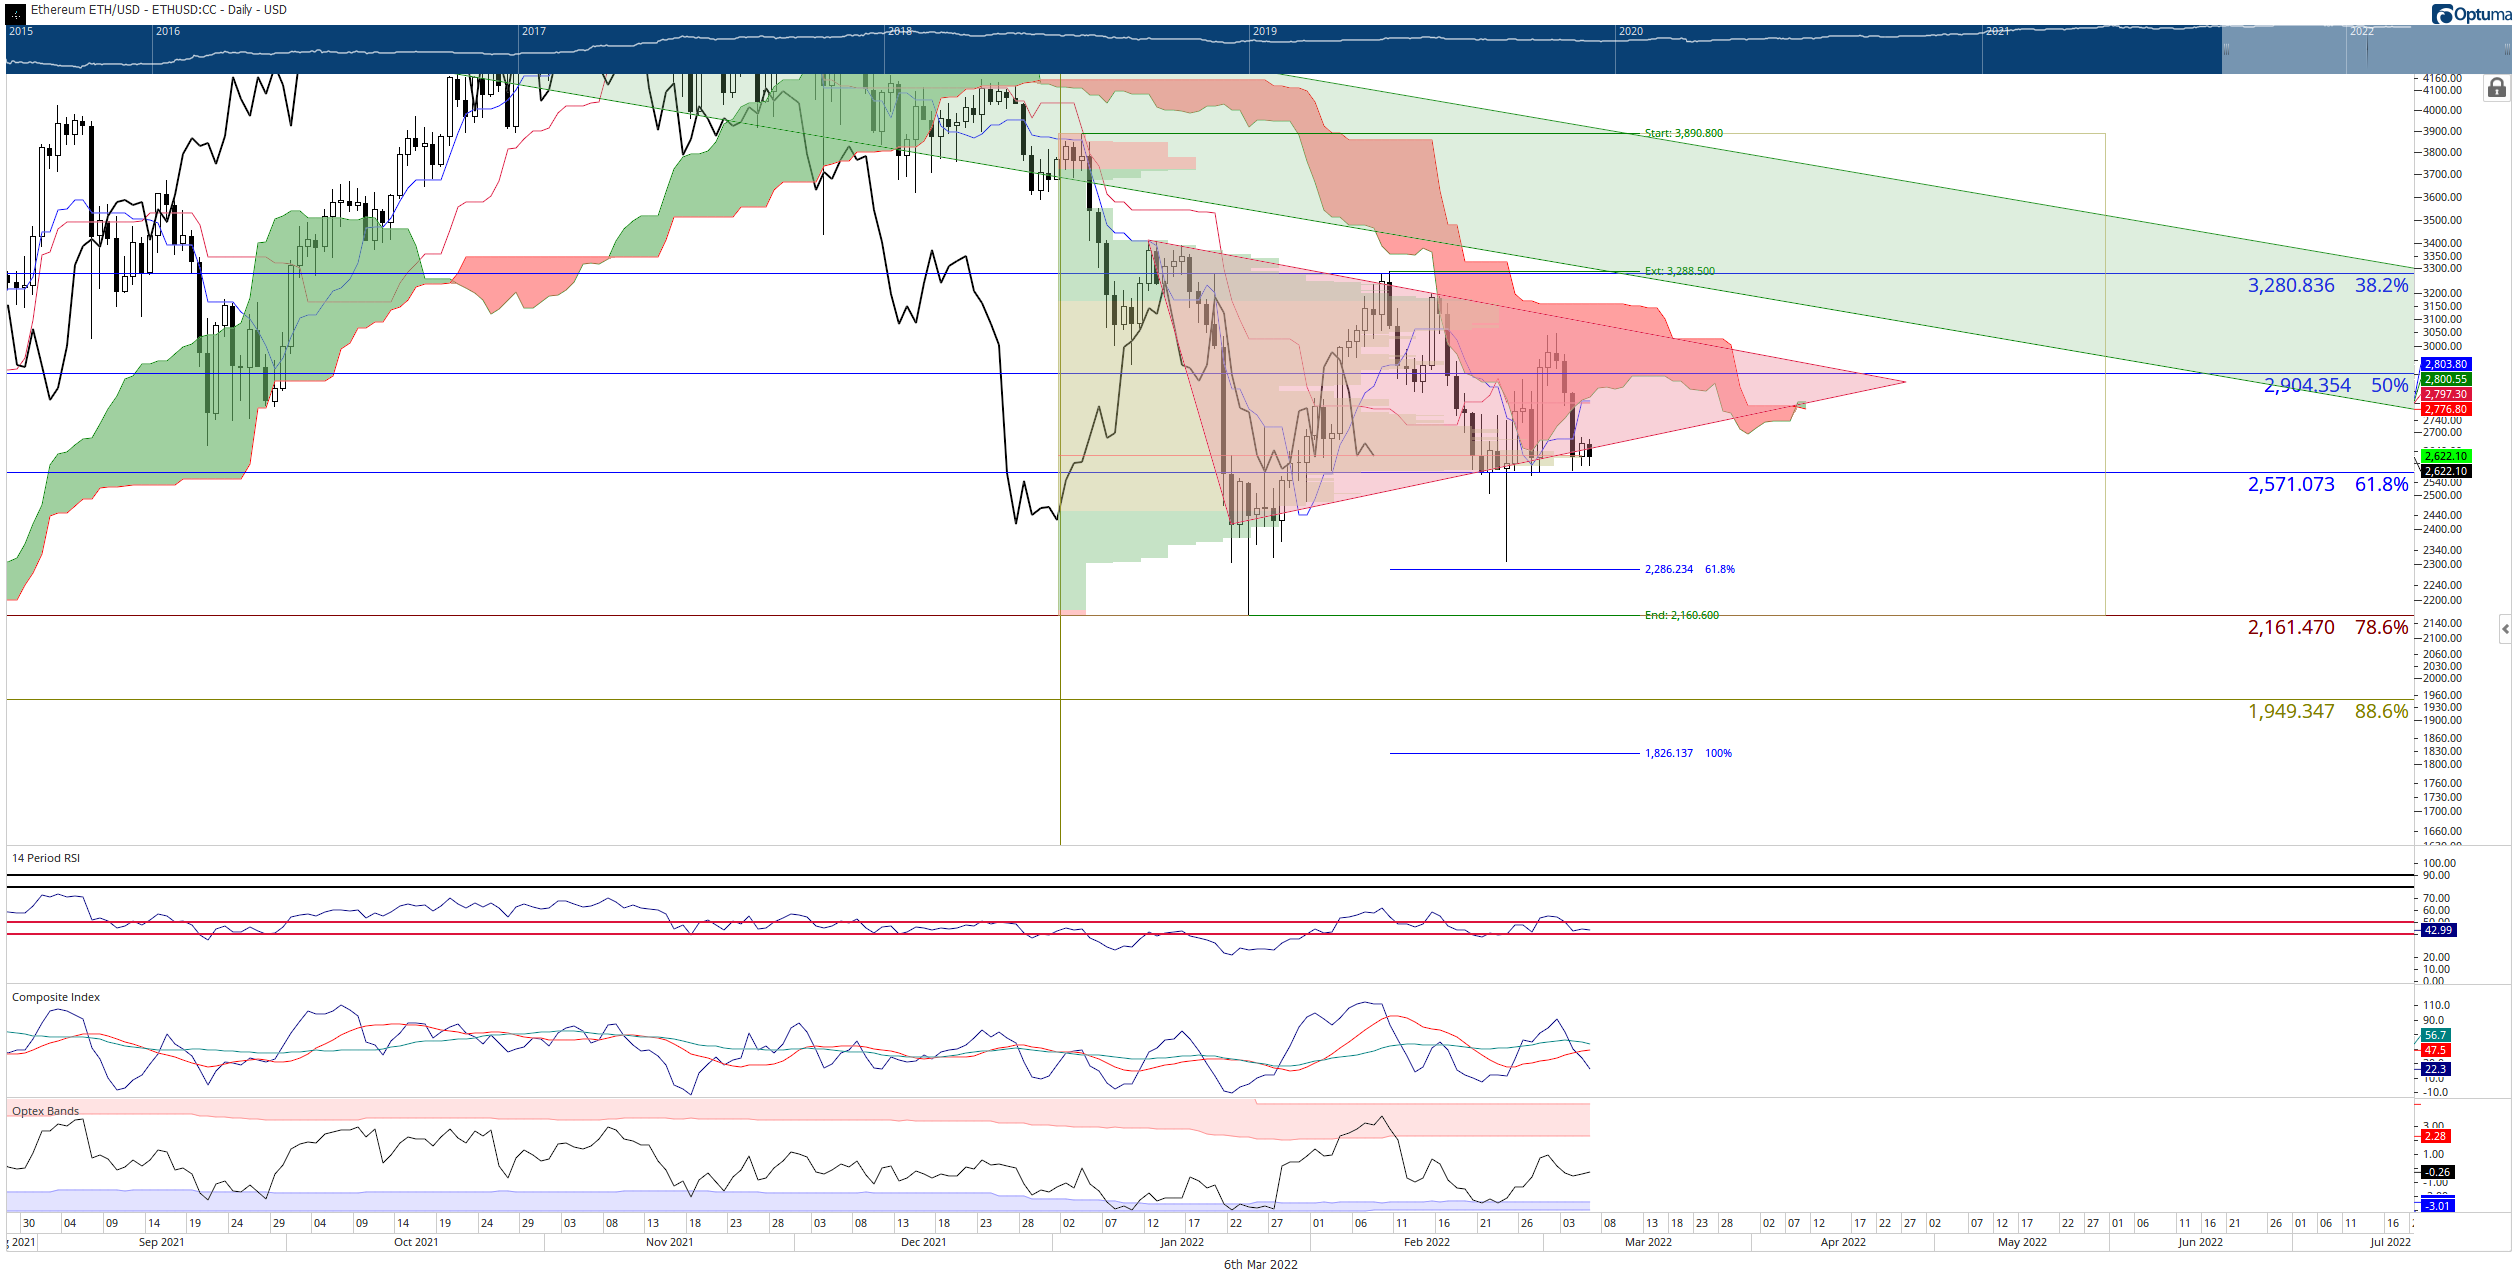
ETH/USD Daily Ichimoku Kinko Hyo Chart
The projected stopping point on a confirmed breakout below the bearish pennant and the $2,500 support zone is the 100% Fibonacci expansion at $1,825.
If bulls want to deny any further bearish price action for Ethereum price, then they need to accomplish the extremely unlikely feat of closing above the Ichimoku Cloud at or above $3,165 – a feat not likely to occur anytime soon.
Author

Jonathan Morgan
Independent Analyst
Jonathan has been working as an Independent future, forex, and cryptocurrency trader and analyst for 8 years. He also has been writing for the past 5 years.


