- Ethereum Classic price tops out at $27.00 as declines loom beneath a rising channel.
- The MACD is ready to validate ETC’s pullback with a sell signal.
- Short-term support at the 200-day SMA could pave the way for ETC to resume uptrend.
Ethereum Classic price turned red on Sunday after completing a breakout move to $27.00, as analyzed by FXStreet earlier this week. This rebound respected the confines of a rising parallel channel, but profit booking seems to be curtailing the extension of ETC’s bullish leg above $30.00.
Ethereum Classic price bows to immense resistance
The move to $27.00 largely depended on support at $22.20. Moreover, a four-hour candlestick close above the hurdle turned support area at $24.00 validated the bullish outlook in the Ethereum Classic price.
As mentioned, ETC moved within the boundaries of a rising parallel channel to $27.00. Despite this impressive move, the Ethereum Classic price has now flipped bearish – thanks to investors booking early profits.
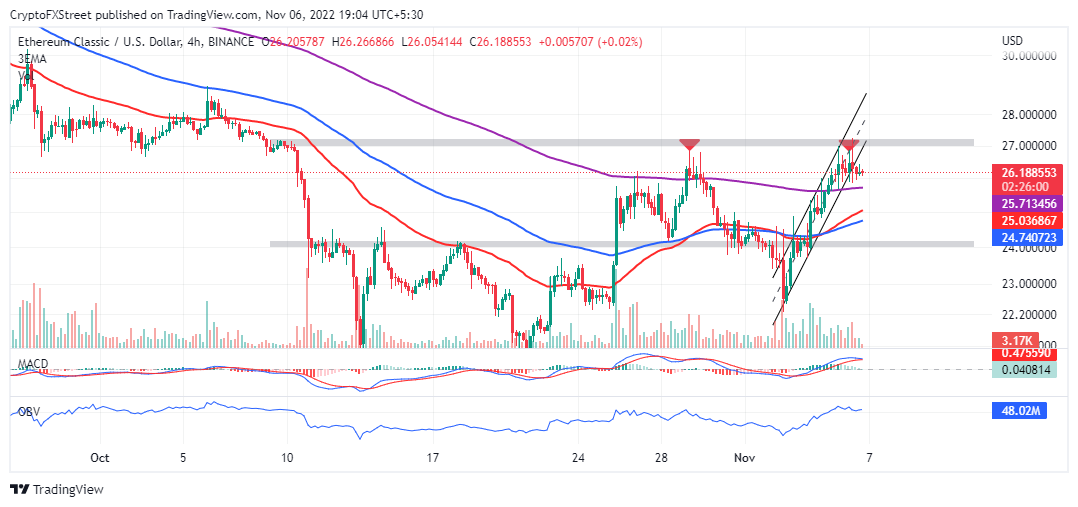
ETCUSD four-hour chart
Short-term sell orders will immediately turn profitable if support at $26.00 bows to the building overhead pressure. Besides, the Moving Average Convergence Divergence (MACD) will likely confirm a sell signal before the new week.
Traders must be careful when planning their next move to avoid sudden bullish pullbacks. Sell orders can only be triggered after the 12-day Exponential Moving Average (EMA) (in blue) has crossed below the 26-day EMA.
It is necessary to wait for the Ethereum Classic price to make a clean break under the 200-day EMA (in purple) before flipping strongly bearish. According to the On-Balance-Volume (OBV) indicator, most of the traded volume is negative.
In other words, traders seem determined to sell ETC for short-term profit targets at the 200-day EMA, the 50 EMA (in red) and support mentioned at $24.00. If push comes to shove, Ethereum Classic will stretch the leg to $22.20 before recovery comes into play.
On the other hand, a bullish outcome in Ethereum Classic price cannot be completely ruled out, especially with the token holding above the three moving averages – the 50-day EMA, the 100-day EMA (in blue) and the 200-day EMA.
A four-hour candlestick close above its weekly peak at $27.00 could add credence to Ethereum Classic’s bullish narrative with targets at $30.00 and $34.00, respectively.
Information on these pages contains forward-looking statements that involve risks and uncertainties. Markets and instruments profiled on this page are for informational purposes only and should not in any way come across as a recommendation to buy or sell in these assets. You should do your own thorough research before making any investment decisions. FXStreet does not in any way guarantee that this information is free from mistakes, errors, or material misstatements. It also does not guarantee that this information is of a timely nature. Investing in Open Markets involves a great deal of risk, including the loss of all or a portion of your investment, as well as emotional distress. All risks, losses and costs associated with investing, including total loss of principal, are your responsibility. The views and opinions expressed in this article are those of the authors and do not necessarily reflect the official policy or position of FXStreet nor its advertisers. The author will not be held responsible for information that is found at the end of links posted on this page.
If not otherwise explicitly mentioned in the body of the article, at the time of writing, the author has no position in any stock mentioned in this article and no business relationship with any company mentioned. The author has not received compensation for writing this article, other than from FXStreet.
FXStreet and the author do not provide personalized recommendations. The author makes no representations as to the accuracy, completeness, or suitability of this information. FXStreet and the author will not be liable for any errors, omissions or any losses, injuries or damages arising from this information and its display or use. Errors and omissions excepted.
The author and FXStreet are not registered investment advisors and nothing in this article is intended to be investment advice.
Recommended Content
Editors’ Picks
This is how XRP whales and the Ripple community set the altcoin up for a 20% rally
XRP price took the entire crypto market by surprise after the massive spike observed on March 19. The single-day increase was the biggest rise noted by the altcoin since September 2022, which set investors scrambling as they tried to make the most of it.
Optimism Price Forecast: Could the Arbitrum airdrop send OP 12% south as market rival makes headlines?

Optimism price (OP) has been moving horizontally within a fixed supplier congestion zone and could break out soon. The expected trajectory for OP comes amid an alt season with rival Ethereum Layer 2 (L2) token Arbitrum holding its airdrop event.
Here is what you can expect from Arbitrum price after major exchanges list ARB

Binance, Coinbase, Bybit, and Huobi crypto exchanges, among others, have confirmed plans to list Arbitrum ARB token ahead of Thursday's airdrop. After the airdrop, users will be able to trade ARB/BTC and ARB/USDT pairs.
SEC issues alert, states crypto service providers may not be complying with US laws

The crypto market has been in the crosshairs of the Securities and Exchange Commission (SEC) for a while now. The lack of clear regulations and the recent collapse of crypto companies and tokens has increased concerns among investors.
Weekly Recap: Bank runs, stablecoin drama, Voyager bankruptcy hearing, threat to DOX Shiba Inu founder

US bank runs sent shockwaves through market participants, traders turned to Bitcoin and the “safe haven” narrative made a comeback. Binance’s $1 billion acquisition of bankrupt crypto lender Voyager is back on track with a ruling from a New York bankruptcy judge.