Ethereum Classic price action: is it delivering its most bullish signal of the year?
- Ethereum Classic price action points to a very bullish breakout according to a technical indicator.
- ETC price action faces many hurdles and caps that could quickly slow down the rally.
- A big bullish catalyst is needed, and several elements will need to work together to bring ETC price back to $32.90.

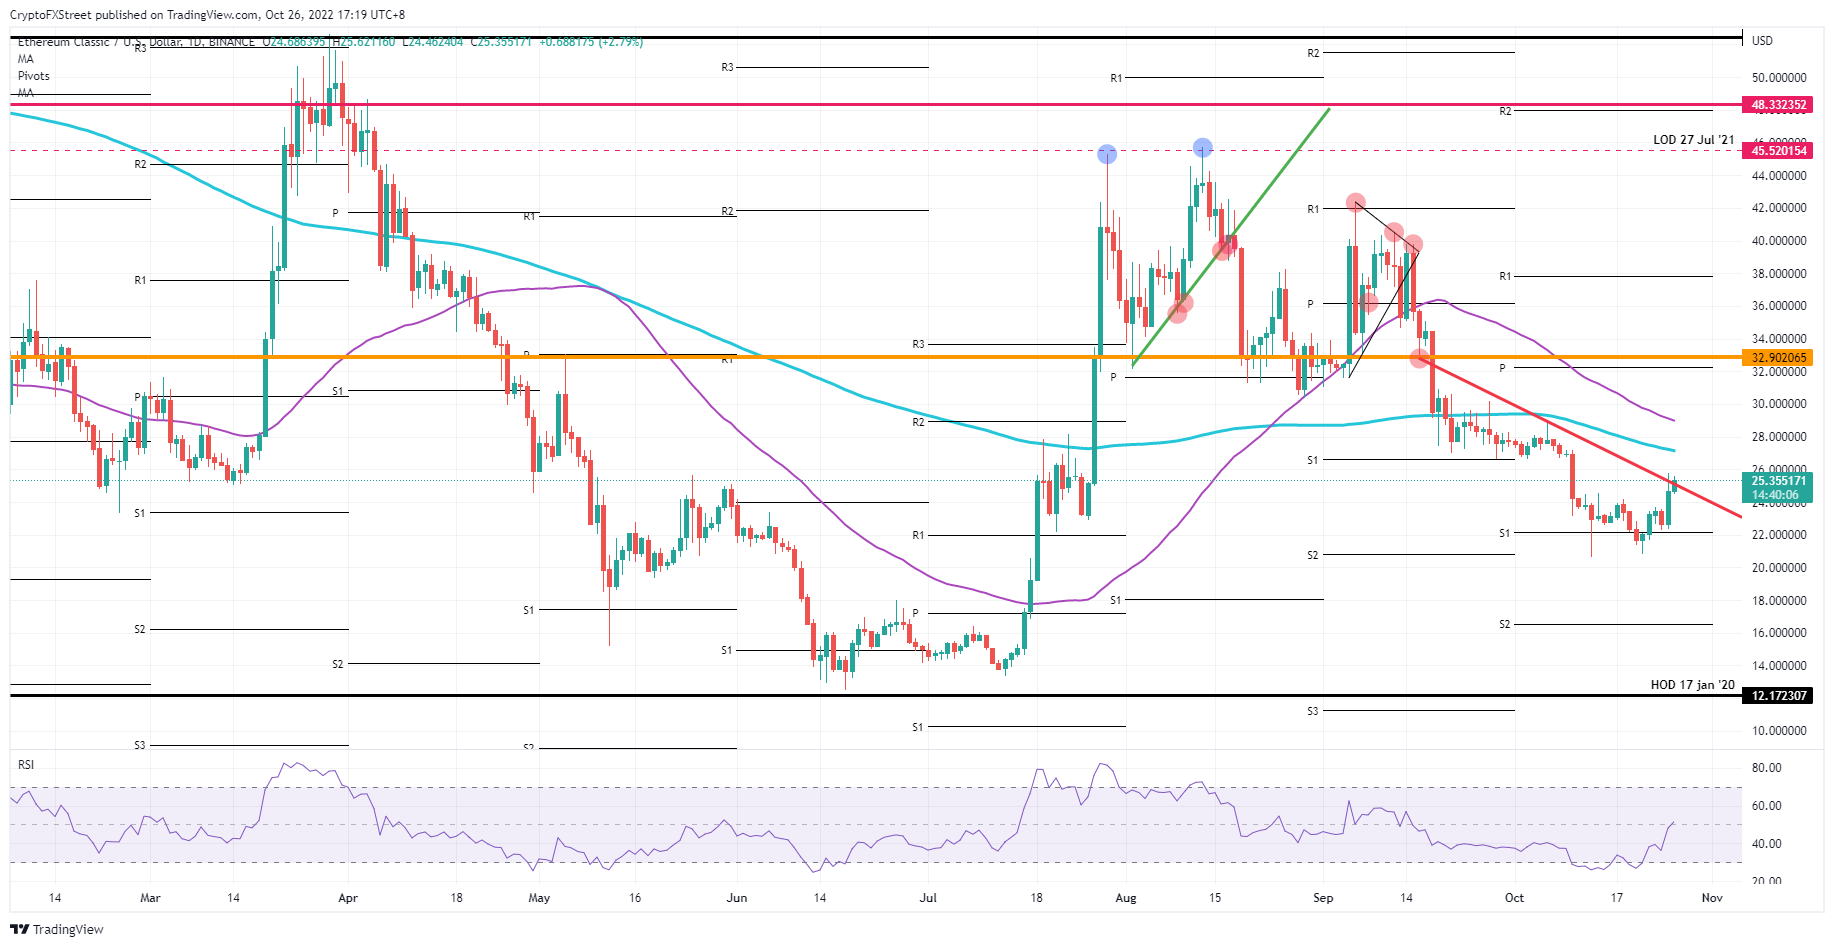
Ethereum Classic price action is set to rally if the current signals are reliable. Bullish signs point to a break above the red descending trendline, which has been pushing price action to the downside since September. Although this signals that every bull will want to get in on the trade, tight trade management is needed as several hurdles could easily trigger a rejection and push price action back to the downside.
ETC price demands a tight and thorough trade management
Ethereum Classic price action is showing signs that it could jump some more percentages to the upside. First is the break above the red descending trend line, which is just plain and simple, a bullish signal. Secondly, the rally in equity markets is helping lift sentiment and should see more upside potential to come.
ETC price action, however, has a few hurdles to face, so tight and realistic trade management is needed when trading this rally. The first hurdle is the 200-day Simple Moving Average (SMA) at $27.18, which is already acting as a cap in July and throughout September. Secondly, the 55-day SMA at $29 looks set to trigger another profit-taking event after the 200-day SMA which is likely to have already slowed down the rally, and the 55-day will probably be the end of the line with $32.90 out of reach.
ETC/USD Daily chart
The risk to the downside could come from earnings out later this week if they start to deteriorate a little bit further. With still some big tech names on the docket, such as Apple, sentiment could easily switch and turn into a cramp. That would mean that the break above the red descending trend line will turn out to be a false bull trap, leading to a pullback towards $22. From there, more downside is set, with $20 due for a third test.
Author

Filip Lagaart
FXStreet
Filip Lagaart is a former sales/trader with over 15 years of financial markets expertise under its belt.


