|

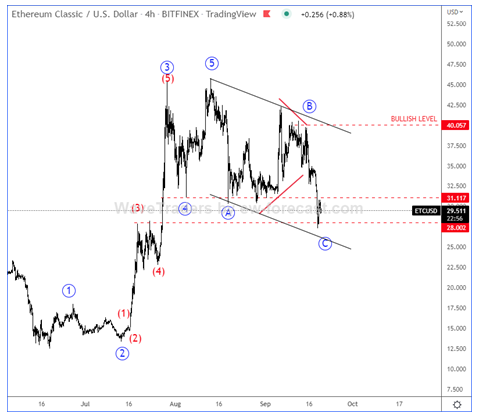
Ethereum Classic is showing bullish pattern

ETCUSD was very strong in the last couple of weeks, where we can count five waves up from the lows. A five-wave rally actually suggests that support/bottom is in place, especially if we see a slow three-wave A-B-C corrective pullback like in our case. Currently we an see it approaching important support zone for wave C, so if we see strong or impulsive bounce back above channel resistance line and 40 region, then we can easily expect a bullish resumption.

Chart

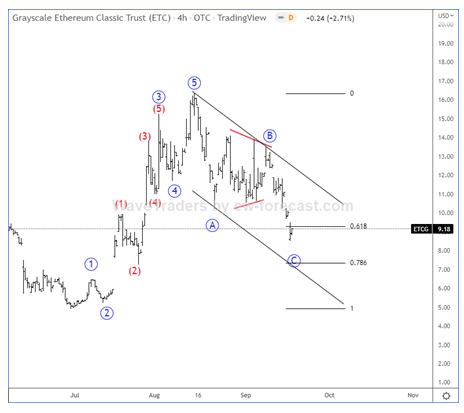
Another evidence why ETCUSD can be forming a bullish setup is ETCG (Ethereum Classic Grayscale Investment Trust) chart, which we also see it finishing an A-B-C corrective setback that can stop here around golden 61,8% Fibo. support. The most interesting part is that wave B was a triangle, which wave 2 cannot be and this is of the main reasons why current decline from the highs seems to be corrective within uptrend.

ETCUSD

Get Full Access To Our Premium Analysis For 14 Days. Click here!


Get Full Access To Our Premium Elliott Wave Analysis For 14 Days. Click here.

Author

Gregor Horvat

Gregor Horvat

Wavetraders

Experience Grega is based in Slovenia and has been in the Forex market since 2003.

More from Gregor Horvat
Share:

Editor's Picks

Ripple extends losses as derivatives interest cools

Ripple (XRP) extends its bearish roll near $1.12 support on Friday, reflecting intense headwinds in the broader crypto market largely attributable to macroeconomic pressure.

Crypto Today: Bitcoin, Ethereum, XRP weaken further as capital outflows persist

Macroeconomic headwinds continue to weigh heavily on the cryptocurrency market on Friday, prompting major assets like Bitcoin (BTC) to pare earlier gains and extend losses after June’s brief relief rally.

Bitcoin Weekly Forecast: Recovery hopes fade after the Fed spoils the party

Bitcoin is set to end the week in the red, trading near the 200-Week Simple Moving Average at around $62,300 on Friday. Institutional selling persists, capping BTC’s recovery as spot Exchange Traded Funds point to a sixth consecutive week of outflows.

Sui risks a deeper bearish leg despite on-chain resilience

Sui is down 2% on Friday, extending its decline toward the recent support leg formed at $0.6618. The Total Value Locked in the Sui ecosystem has stabilized around 600 million SUI tokens, reflecting resilient user demand.

Bitcoin: Recovery hopes fade after the Fed spoils the party
Bitcoin (BTC) is set to end the week in the red, trading near the 200-Week Simple Moving Average (SMA) at around $62,300 on Friday. Institutional selling persists, capping BTC’s recovery as spot Exchange Traded Funds (ETFs) point to a sixth consecutive week of outflows.