ETH/USD: Strong $118 line sees a mixture of confluences - Confluence Detector
- ETH/USD market keeps slipping as the bears take over.
- Market supported at $118 by a potent mix of confluences.

ETH/USD bears have been extremely active during Monday and Tuesday, taking the market’s value down from $126.50 to $119.50. The bulls will need to fight back but see very stiff resistance ahead. They can bounce back from strong support which lies at $118, according to the daily ETH/USD confluence detector.
ETH/USD daily confluence detector
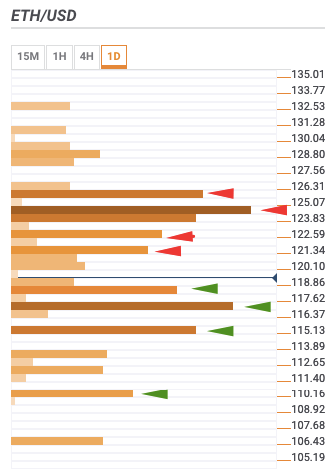
According to the daily ETH/USD confluence detector, strong resistances lie at $122, $123, $124.50, and $126. The confluences at those levels are:
- $122: 15-min Bollinger band middle curve, hourly previous high, 5-day simple moving average (SMA 5), SMA 100, hourly Bollinger band middle curve, SMA 10, and daily 23.6% Fibonacci retracement level.
- $123: 4-hour previous high and daily 38.2% Fibonacci retracement level.
- $124.50: Daily pivot point and upper curve of the daily Bollinger band, previous week high, daily 61.8% Fibonacci retracement level, and 4-hour upper curve of the Bollinger band.
- $126: 50-day simple moving average and monthly 38.2% monthly Fibonacci retracement level.
Strong support levels for the market are at $119, $117, $115.50, and $110.50. The confluences for those levels are at:
- $119: SMA 5, weekly 23.6 Fibonacci retracement level, and the hourly previous low.
- $117: Daily pivot point, SMA 200, and 23.6% monthly Fibonacci retracement level.
- $115.50: 38.2% weekly Fibonacci retracement level.
- $110.50: SMA 100, weekly 61.8% Fibonacci retracement level.
Author

Rajarshi Mitra
Independent Analyst
Rajarshi entered the blockchain space in 2016. He is a blockchain researcher who has worked for Blockgeeks and has done research work for several ICOs. He gets regularly invited to give talks on the blockchain technology and cryptocurrencies.


