ETH/USD shows pullback in strong bullish impulse and large uptrend
-
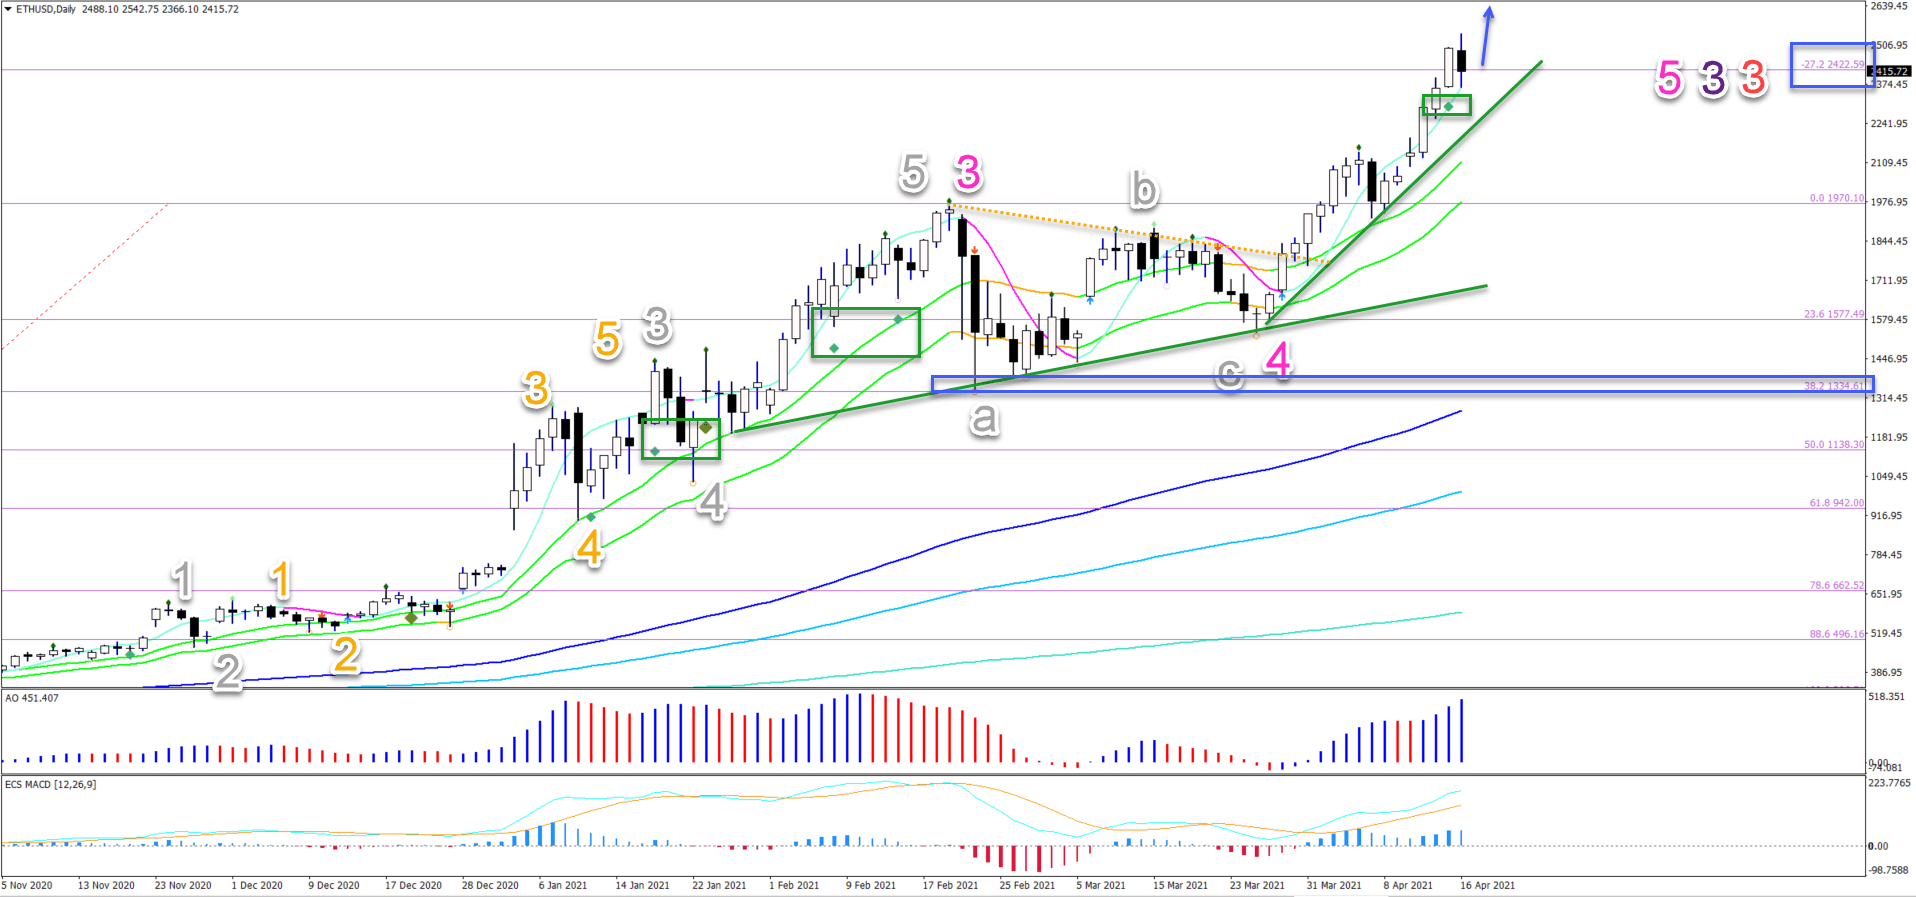
Ethereum (ETH/USD) continued with the uptrend and made another higher high. Price action has now reached the first -27.2% Fibonacci target.
-
The ETH/USD completed a bearish ABC (grey) pattern in wave 4 (pink) after bouncing at the 38.2% Fibonacci retracement level (blue box).
-
The upside is probably part of multiple wave 3 patterns (purple/red). The next targets are at the -61.8% Fibonacci level around $2800 and the round $3000 level.

Can the uptrend continue higher? And if so, what are the next targets?
Price charts and technical analysis
The ETH/USD completed a bearish ABC (grey) pattern in wave 4 (pink) after bouncing at the 38.2% Fibonacci retracement level (blue box):
-
Price action has reached the first -27.2% Fibonacci target (smaller blue box).
-
The momentum is very strong because of these reasons:
-
Daily candles are showing an impulse with a majority of large bullish candles closing near the daily high.
-
The HMA 20 has a bullish angle with price action above it.
-
The momentum indicator confirms that 10 daily candles have not hit the 21 ema zone (green box). Usually, the momentum continues (see green boxes before) higher.
-
The 21 ema zone has a steep angle and all of the moving averages are bullishly aligned with large spaces between the MAs.
-
-
Considering the strong momentum, an immediate continuation has the highest probability (blue arrow).
-
The next targets are at the -61.8% Fibonacci level around $2800 and the round $3000 level.
-
The upside is probably part of multiple wave 3 patterns (purple/red).
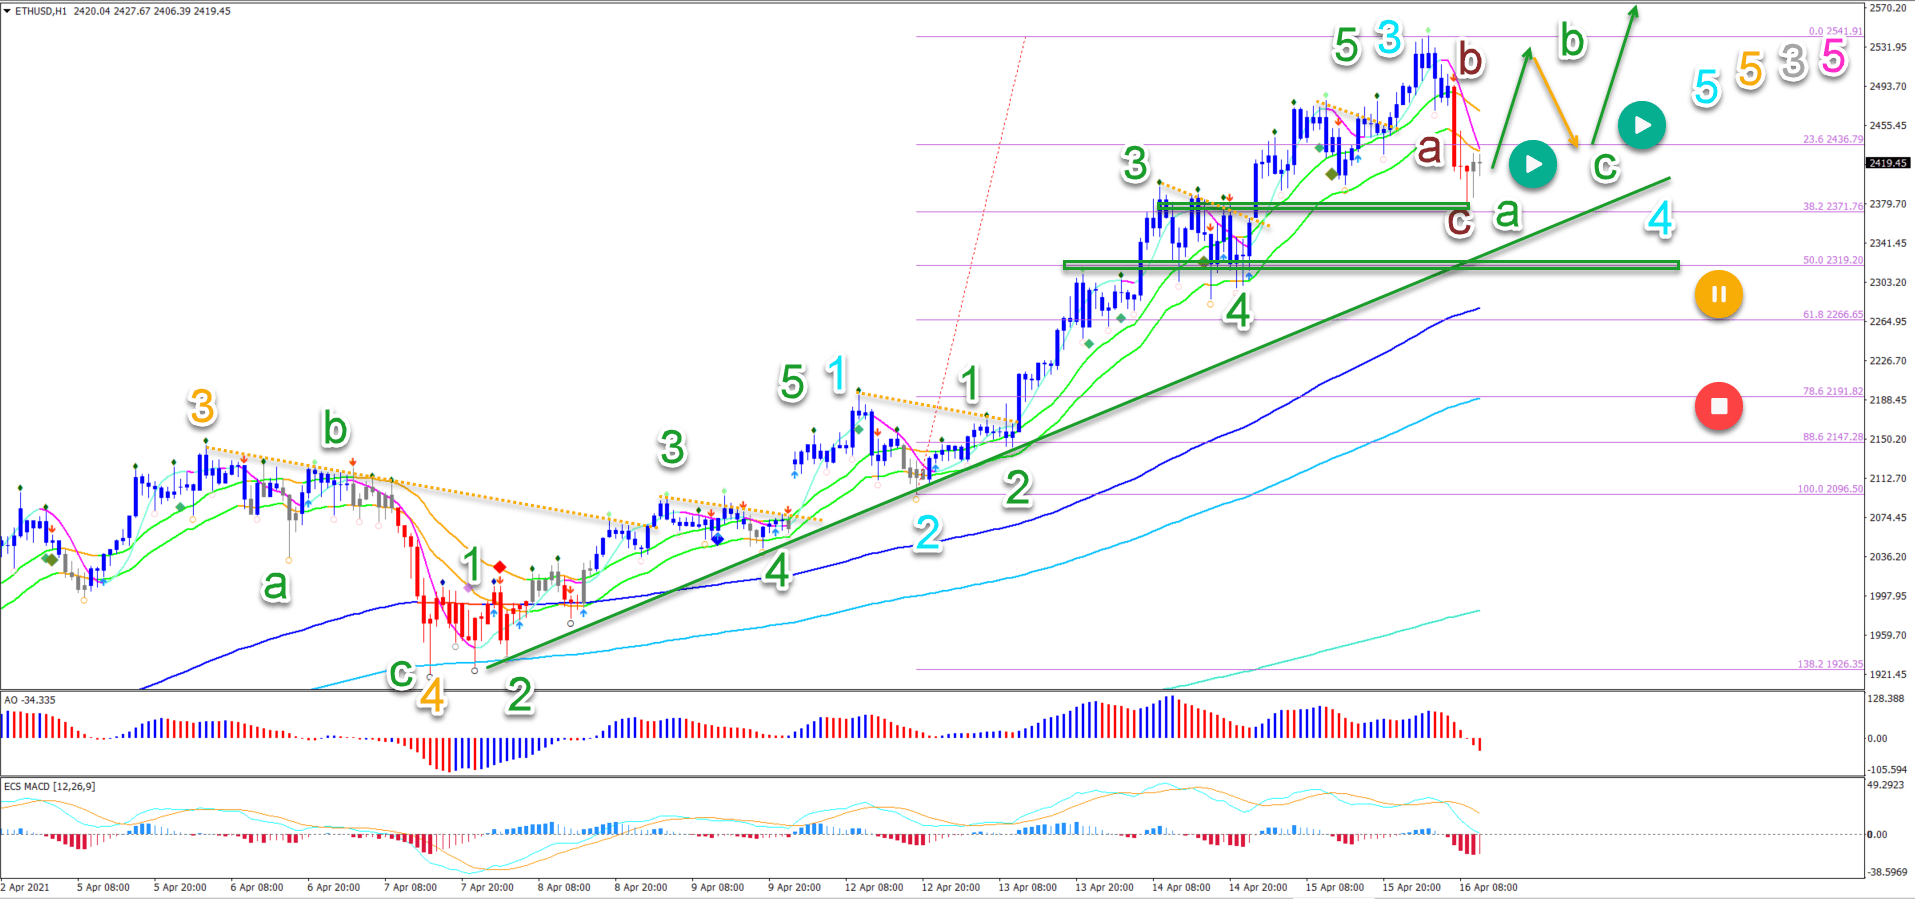
On the 1 hour chart, price has been above the 21 ema for more than 1 week now. The bullish bounce at the 144-233 ema zone on the left of the chart was followed by another round of buying:
-
The wave patterns suggest an ongoing wave 3 (grey) considering the strong bullish momentum.
-
The current pullback respected the 38.2% Fibonacci of the shallow price swing. This could be a wave A (green) of a larger ABC (green) in wave 4 (blue).
-
The 1st or 2nd breakout above the 21 ema zone (green arrow) could confirm the uptrend continuation.
-
The uptrend certainly remains strong as long as price action remains above the 144-233 ema long-term MA.
-
This wave outlook is confirmed if there are bullish bounces at the support zone and max 50% Fib. A break below the 50% Fib places it on hold (yellow) and a deeper retrace invalidates it (red).
The analysis has been done with the ecs.SWAT method and ebook.
Author

Chris Svorcik
FS method
Chris Svorcik is a trader, analyst, and educator with over 15 years of experience in financial markets, specializing in moving averages, market structure, and price patterns.


