|

ETH/USD buying the dips after Elliott Wave double three

In this article we’re going to take a quick look at the Elliott Wave charts of Ethereum ETHUSD published in members area of the website.  As our members know ETHUSD has given us nice bullish trading setup recently. We got a pull back that has ended at the Blue Box zone,our buying area.  In the further text we are going to explain the Elliott Wave Forecast and trading setup.

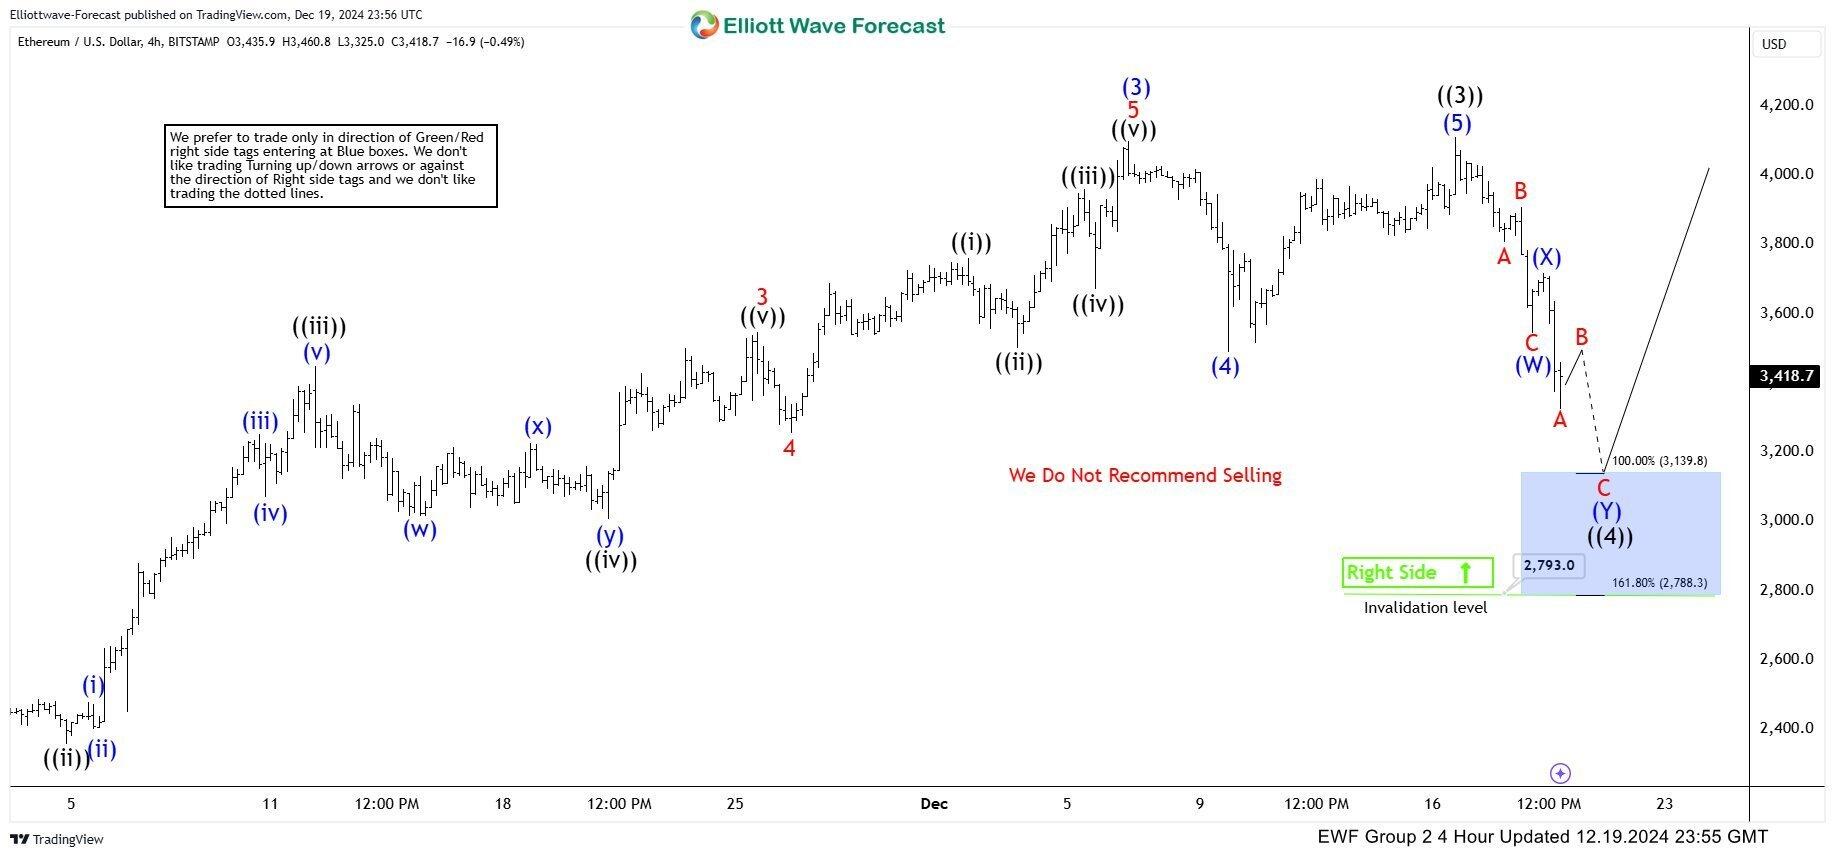
ETH/USD Elliott Wave one-hour chart 12.19.2024

Ethereum is currently in a correction, forming an Elliott Wave Double Three pattern. The structure is still incomplete, and the pullback is creating lower lows. ETHUSD is likely to drop further into the 1139.8 – 2788.3 range (blue buying zone).

We don’t recommend selling ETHUSD and prefer looking for buying opportunities. From this zone, ETHUSD is expected to either rally to new highs or make a 3-wave bounce.

Once the bounce reaches the 50% Fibonacci level relative to the (X) high, we’ll move the stop loss to break-even (BE) and take partial profits.

Official trading strategy on How to trade 3, 7, or 11 swing and equal leg is explained in details in Educational Video, available for members viewing inside the membership area.

Quick reminder on how to trade our charts :

Red bearish stamp+ blue box = Selling Setup
Green bullish stamp+ blue box = Buying Setup
Charts with Black stamps are not tradable.

ETHUSD

ETH/USD Elliott Wave one-hour chart 12.26.2024

ETHUSD made an extension toward our buying zone: 1139.8 – 2788.3  as expected. The crypto found buyers at the Blue Box , and we got a good reaction from there. The bounce reached 50 fibs against the (X) connector. As a result, traders who entered long positions are now enjoying risk-free profits. With the price holding above the 3099  low, we expect further strength to follow.

ETHUSD

Author

Elliott Wave Forecast Team

Elliott Wave Forecast Team

ElliottWave-Forecast.com

More from Elliott Wave Forecast Team
Share:

Markets move fast. We move first.

Orange Juice Newsletter brings you expert driven insights - not headlines. Every day on your inbox.

By subscribing you agree to our Terms and conditions.

Editor's Picks

AAVE slips below $186 as bearish signals outweigh the SEC investigation closure

Aave (AAVE) price continues its decline, trading below $186 at the time of writing on Wednesday after a rejection at the key resistance zone. Derivatives positioning and momentum indicators suggest that bearish forces still dominate in the near term.

Hyperliquid stabilizes amid plans to burn assistance fund

Hyperliquid (HYPE) stabilizes above $26 at press time on Wednesday after three straight days of losses. Hyperliquid Foundation has started a validator vote to reduce supply by burning the assistance fund, which holds over 37 million HYPE tokens.

Top 3 Price Prediction: Bitcoin, Ethereum, Ripple extend correction as bearish momentum builds

Bitcoin, Ethereum, and Ripple remain under pressure as the broader market continues its corrective phase into midweek. The weak price action of these top three cryptocurrencies by market capitalization suggests a deeper correction.

Ethereum Price Forecast: Active addresses plunge to May levels amid resumption in US selling pressure

Ethereum (ETH) weekly active addresses have plunged sharply in December, declining from 440K to 324K, levels last visited in May. The decline in active addresses has also pushed down the number of transactions on the network to July lows.

Orange Juice Newsletter – Smart insights by real people. Every day.

A free newsletter highlighting key market trends to help traders stay a step ahead. Daily insights on the most relevant trading topics, compiled by our experts in an easy-to-read format so you never miss an important move.

Bitcoin: Fed delivers, yet fails to impress BTC traders

Bitcoin (BTC) continues de trade within the recent consolidation phase, hovering around $92,000 at the time of writing on Friday, as investors digest the Federal Reserve’s (Fed) cautious December rate cut and its implications for risk assets.