EOS price pedals a buying opportunity before a possible 70% run
- EOS price continues to consolidate after breaking above the upper boundary of a bullish reversal pattern.
- EOS could rally 70% to meet the target objective of the technical formation at $1.315.
- The bullish outlook would be invalidated if the price breaks and closes below $0.640 support in the three-day timeframe.

EOS (EOS) price broke out above a falling wedge pattern, kickstarting rally that could see long term holders make double digit profit based on the target objective of the underlying technical formation.
Also Read: EOS price presents a good long term buying opportunity
EOS price eyes 70% gains
EOS price activated a falling wedge pattern after a solid breakout in late November. This technical formation is a reversal chart pattern that changes the bearish trend into a bullish trend. It is formed when the price bounces between two downward-sloping, converging trendlines.
The ideal place to set a target once the price breaks above a falling wedge will be at the upper level where the falling wedge started from, with a stop loss a few pips below the final low before the breakout occurred. Setting the target objective at $1.869 in the 3-day chart for the EOS/USDT trading pair, the ongoing consolidation could be a good buying opportunity for long-term traders looking to capitalize on a possible 140% climb.
Increased buying pressure above current levels could see the EOS price break past the $0.800 level and the $1.00 psychological level to test the 1.315 resistance level. Such a move would constitute a 70% climb above current levels.
In a highly bullish case, the gains could see EOS price flip the $1.315 roadblock into a support floor and use it as the springboard toward the $1.869 resistance level.
The position of the Relative Strength Index (RSI) above the 50 level points to strong price strength, with the green histogram bars of the Awesome Oscillator (AO) in the positive territory adding credence to the bullish outlook.
Also, the Moving Average Convergence Divergence (MACD) indicator is moving above the signal line, showing that the bulls continue to lead the EOS market.
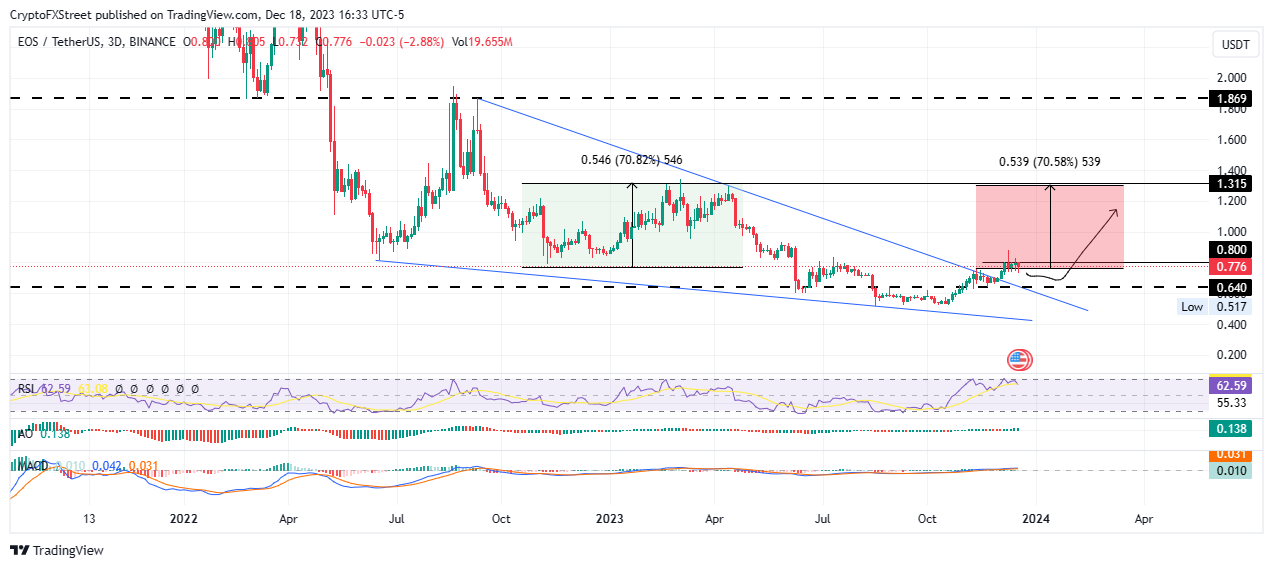
EOS/USDT 3-day chart
On the flip side, increased seller momentum could see EOS price pull south, with the rejection likely to see the price flip the $0.640 support level into resistance. A break and close below this buyer congestion zone would invalidate the prevailing bullish outlook.
Author

Lockridge Okoth
FXStreet
Lockridge is a believer in the transformative power of crypto and the blockchain industry.


