EOS Price Analysis: EOS/USD finds support on the SMA 20 curve as bears retain control
- The Elliott Oscillator has had two green sessions following nine red sessions.
- After failing at the $4.40 resistance line, the bulls are struggling to keep the price above $4.

EOS/USD daily chart
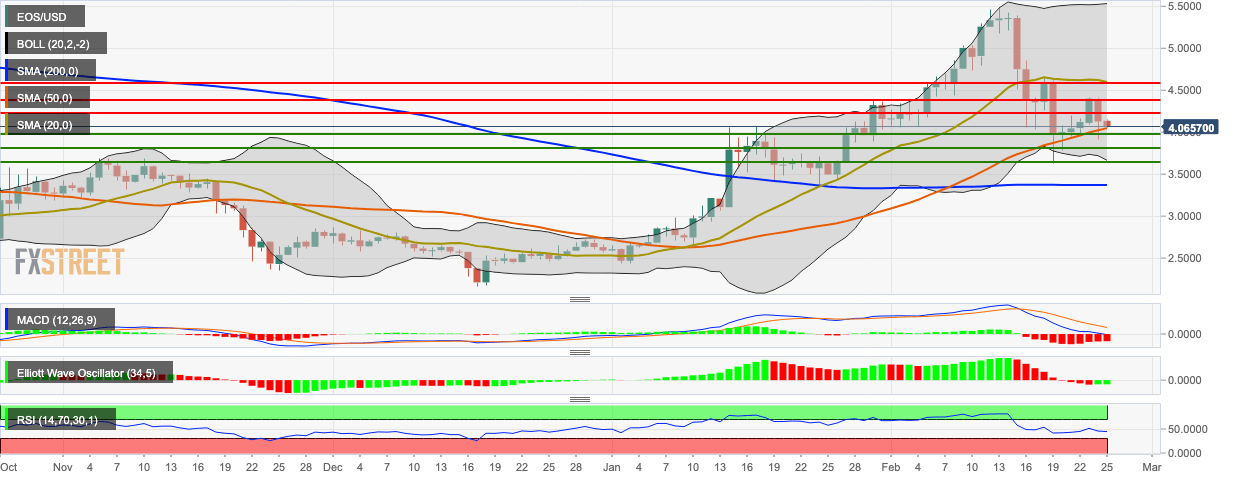
EOS/USD has had a second bearish day in a row as the price dropped from $4.13 to $4.07 in the early hours of Tuesday. Presently, the price has found support at the SMA 20 curve. Earlier this Monday, EOS/USD failed at the $4.40 resistance line and dropped to $4.13. The MACD shows decreasing bullish momentum, while the RSI indicator is trending around the neutral territory The Elliott Oscillator has had two green sessions following nine red sessions, showing that overall market sentiment could be bullish.
Author

Rajarshi Mitra
Independent Analyst
Rajarshi entered the blockchain space in 2016. He is a blockchain researcher who has worked for Blockgeeks and has done research work for several ICOs. He gets regularly invited to give talks on the blockchain technology and cryptocurrencies.


