Elrond price remains overbought, forcing EGLD to retest $300
- Elrond price has been in a solid and persistent uptrend since the week of June 25th.
- No major pullbacks have occurred in over 23 weeks.
- Overbought conditions on the weekly and daily chart indicate a pullback is imminent.

Elrond price has been one of the biggest surprises in the altcoin space for 2021. Rising more than 780% from the June 25th 2021 open at $82.55 to the all-time high recently made on November 23rd at $544.25, it is due for a pullback – one that might be sustained.
Elrond price positioned for a 26% drop to the $300 value area
Elrond price is the definition of overbought on the weekly Ichimoku chart. The Relative Strength Index has two overbought settings in a bull market: 80 and 90. Elrond's Relative Strength Index pushed to the first overbought level at 80 and then moved even higher to hit 90 before facing swift rejection and now dropping below the 80 level. The 'hook' on the Relative Strength Index warns of a steep drop in price action.
The Composite Index, likewise, shows extreme overbought conditions in Elrond price. The arrow on the chart below shows the general rise in Elrond price with higher highs ever since February 2021. However, the arrow on the Composite Index shows a series of lower lows during that same period. This is a development known as regular bearish divergence, warning that the current uptrend will face a correction or broad trend change very soon.
The Composite Index has dropped below the fast-moving average while simultaneously printing a lower high, so a dip is expected. If Elrond closes the weekly candlestick below the Tenkan-Sen at $381, the next Ichimoku support level is a shared support zone in the $300 value area. The Kijun-Sen ($300) and the 38.2% Fibonacci retracement share the same value area and likely act as solid support.
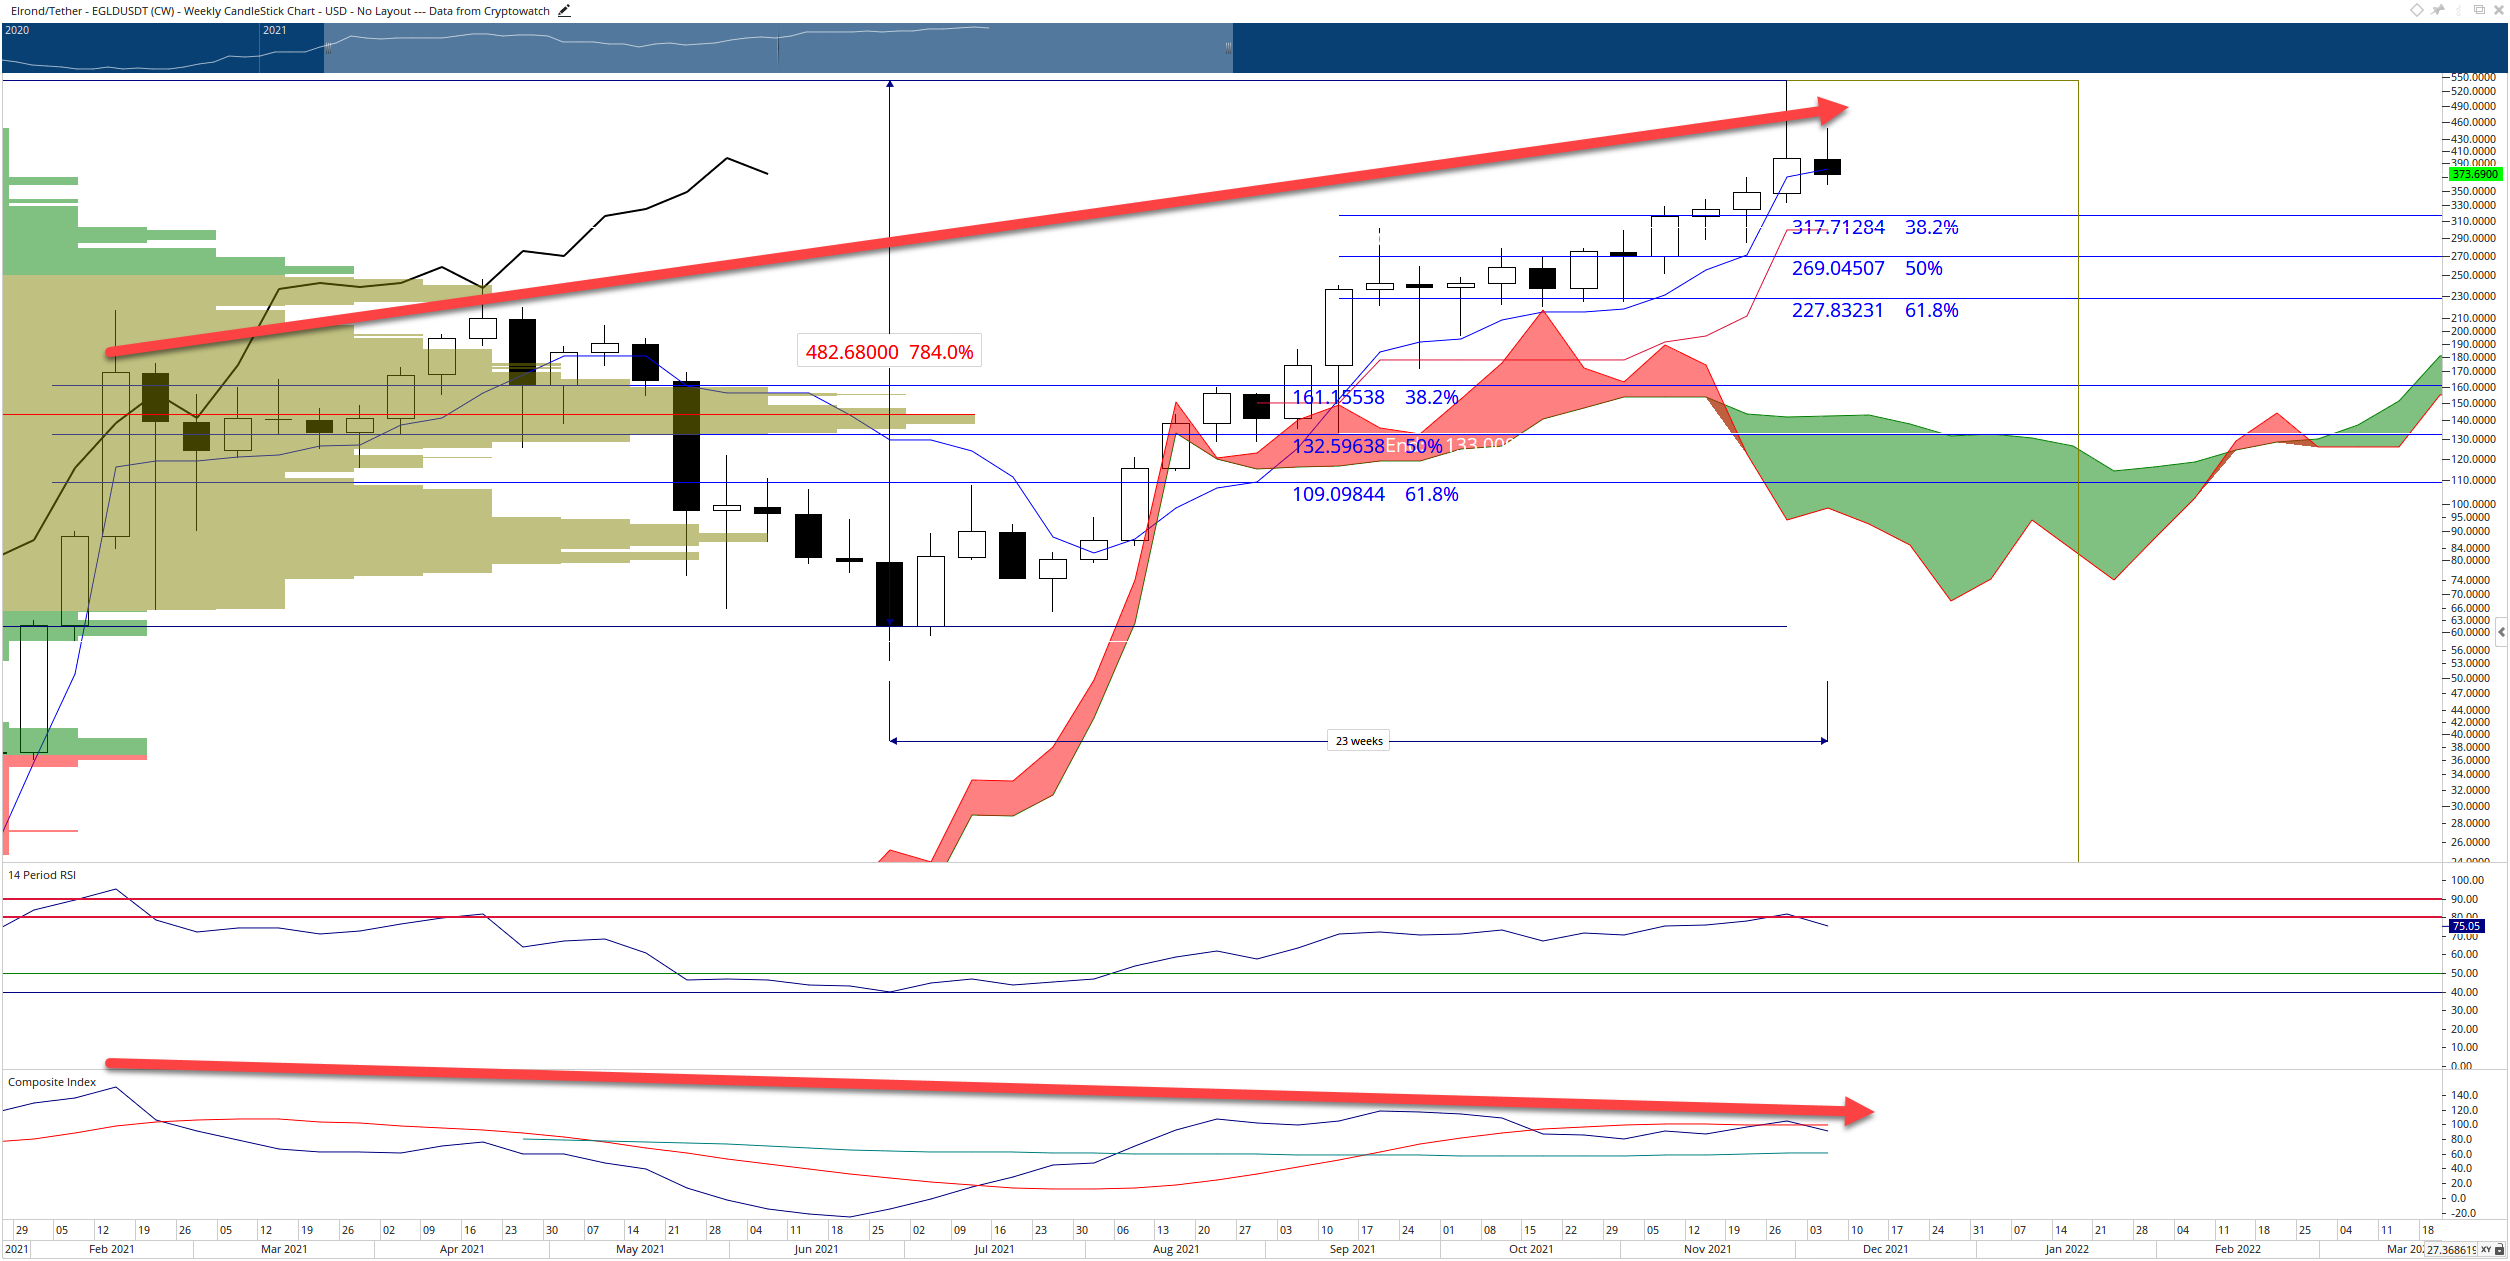
EGLD Weekly Ichimoku Chart
But traders should be aware that Elrond price has respected the Tenkan-Sen as support for almost half a year. Additionally, it remains in price discovery mode, so it isn't unlikely to return to bullish price action. A weekly close above the weekly open would invalidate any near-term bearish retracement projections.
Author

Jonathan Morgan
Independent Analyst
Jonathan has been working as an Independent future, forex, and cryptocurrency trader and analyst for 8 years. He also has been writing for the past 5 years.


