|

Elrond Price Prediction: EGLD to jump by 20% as key indicator screams buy

  • Elrond price is contained inside a descending wedge pattern on the 9-hour chart.
  • The digital asset is on the verge of a breakout towards $180.
  • A key indicator has presented a buy signal that gives the upper hand to the bulls.

After hitting an all-time high of $217 on February 9, Elrond price has suffered a significant pullback down to $65.6 on February 15, but bulls managed to buy most of it pushing the digital asset up to $140.

Elrond price on the brink of a breakout to $180

On the 9-hour chart, Elrond has established a descending wedge pattern which is really close to a breakout or breakdown. The key resistance level is established at $148 and support at $127.

egld price

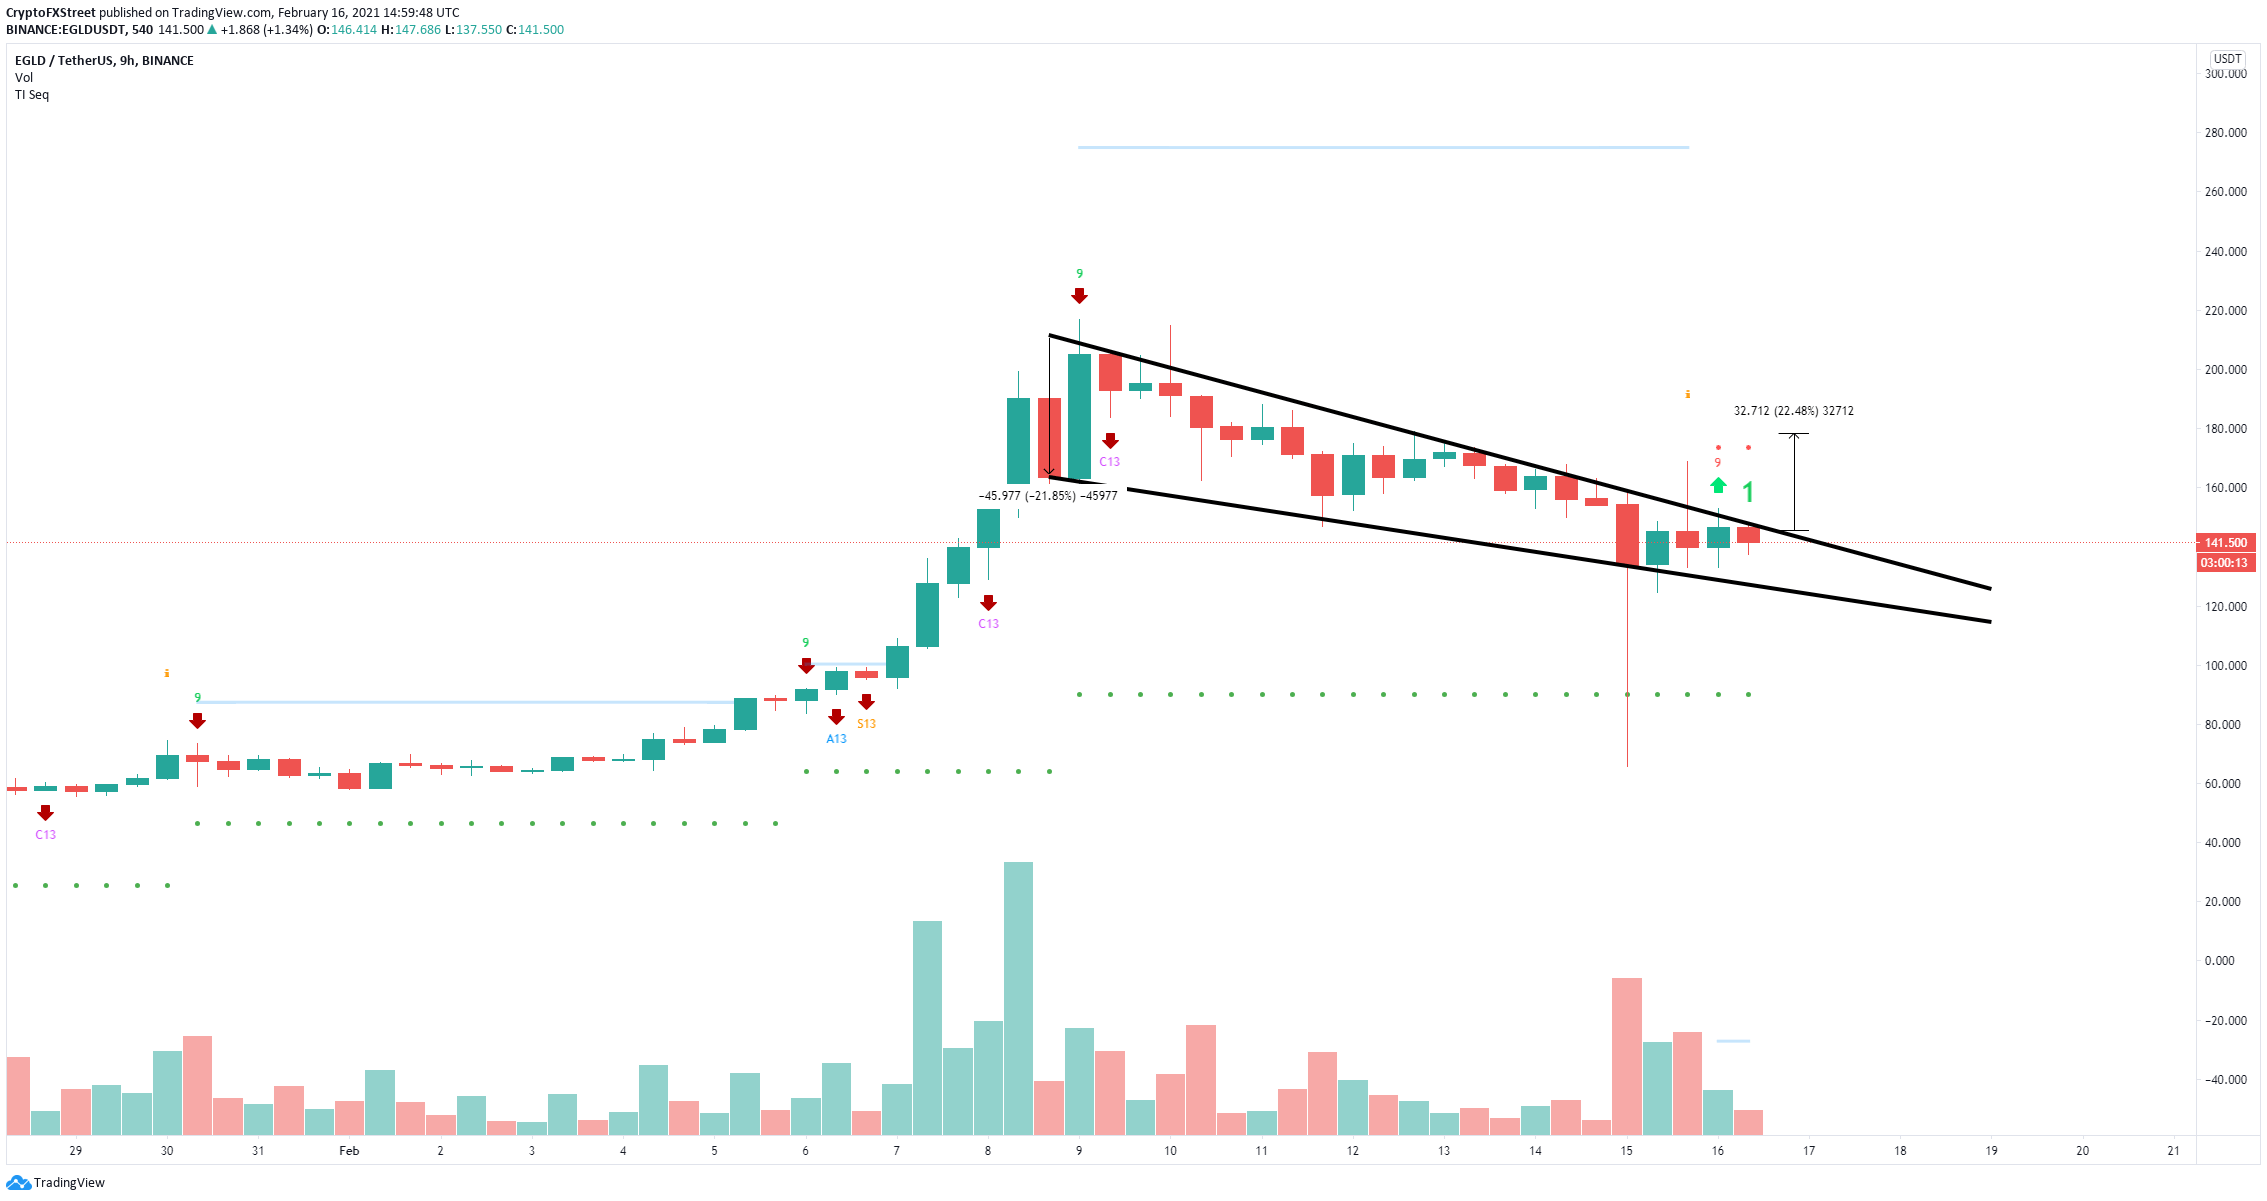
EGLD/USD 9-hour chart

The TD Sequential indicator has just presented a buy signal on the 9-hour chart giving the upper hand to the bulls. A breakout above $148 can quickly push Elrond price towards $180, a 22% move calculated by using the maximum height of the wedge pattern.

egld price

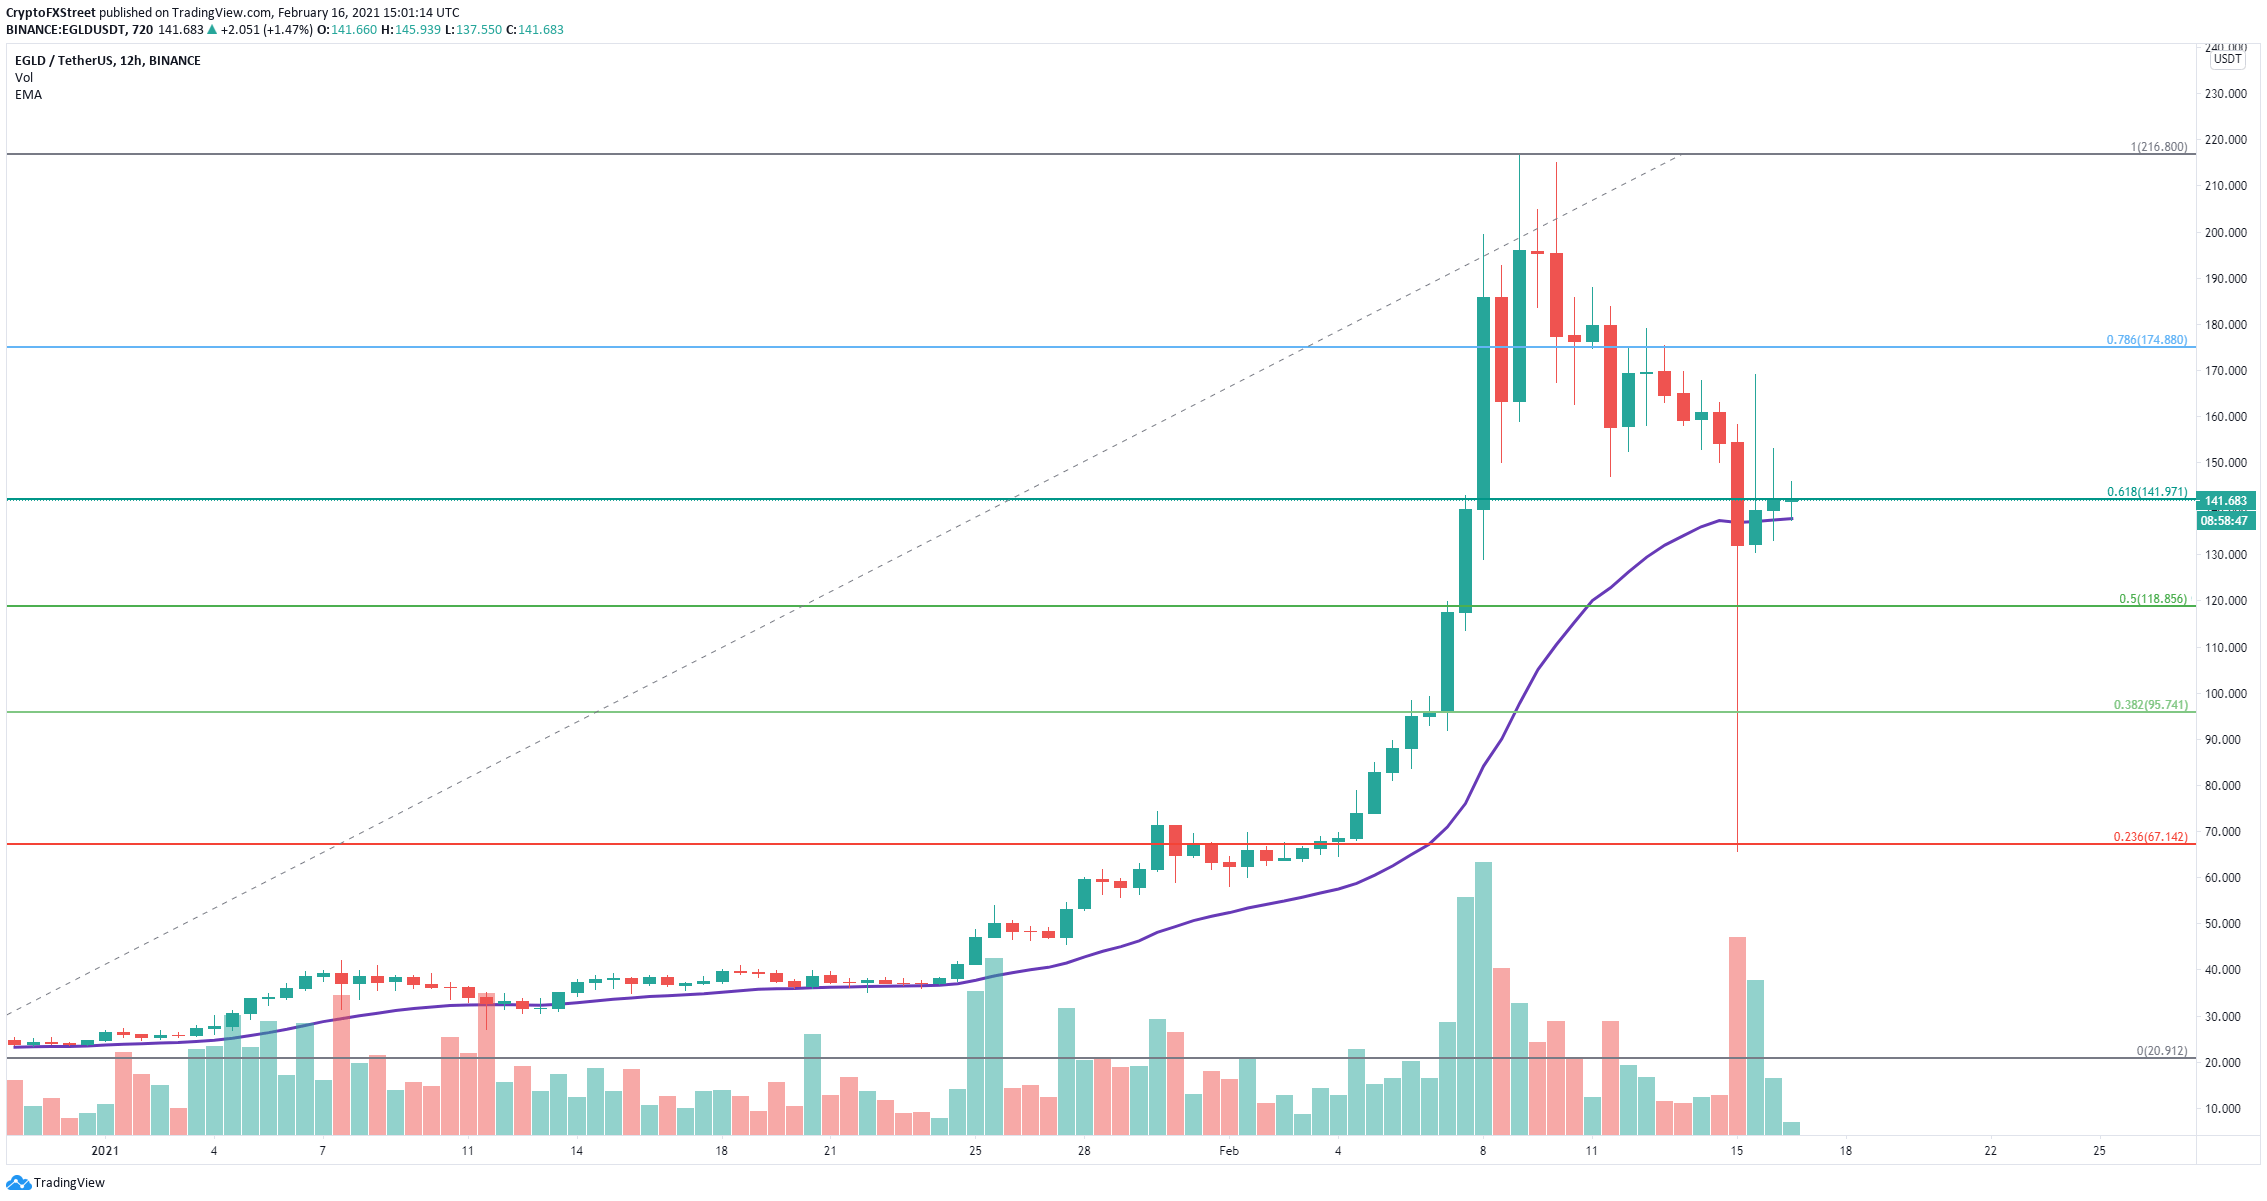
EGLD/USD 12-hour chart

On the 12-hour chart, to invalidate the bullish outlook, bears have to crack the 26-EMA support level at $138, which has been an accurate guide since December 2020. Losing this key level can drive Elrond price down to $118, the 50% Fibonacci Retracement level and as low as $95, at the 38.2% level.

Author

Lorenzo Stroe

Lorenzo Stroe

Independent Analyst

Lorenzo is an experienced Technical Analyst and Content Writer who has been working in the cryptocurrency industry since 2012. He also has a passion for trading.

More from Lorenzo Stroe
Share:

Editor's Picks

Ripple falters amid sell-off jitters and negative funding rates

Ripple (XRP) has come under pressure, drifting lower to $1.35 at the time of writing on Tuesday. The over 2% correction looks poised to erase the previous day’s gains, which lifted the remittance token to $1.42.

Bitcoin could risk $50,000 amid the US-Iran war, mirroring the Russia-Ukraine war losses

Bitcoin (BTC) remains at downside risk amid escalation in the Middle East war, as Iran retaliates against the US, Israel, and its neighbouring countries. Drawing parallels to the early days of the Russia-Ukraine war, Bitcoin could extend losses below $60,000. 

Crypto Today: Bitcoin, Ethereum, XRP pull back as sentiment remains in extreme market fear

The cryptocurrency market is broadly in the red on Tuesday as the Middle East grapples with an escalating war. Bitcoin (BTC) is in a pullback, trading below $67,000 at the time of writing, and most altcoins follow suit.

Bitcoin slips below $67,000 as risk-aversion grows amid escalating US-Iran war

Bitcoin price slides 3% on Tuesday, nearly erasing the previous day's rebound. US-listed spot ETFs recorded an inflow of more than $450 million while Strategy added 3,015 BTC on Monday.

Bitcoin Price Annual Forecast: BTC holds long-term bullish structure heading into 2026

Bitcoin (BTC) is wrapping up 2025 as one of its most eventful years, defined by unprecedented institutional participation, major regulatory developments, and extreme price volatility.

Bitcoin: Another month of losses, and it’s been five

Bitcoin (BTC) price is stabilizing around $68,000 at the time of writing on Friday, but the Crypto King is poised to close February on a fragile footing, marking its fifth consecutive month of losses since October and a rare start to the year with back-to-back monthly corrections.