Elrond price is bound for bigger losses despite EGLD recent rebound
- Elrond’s sentiment has shifted to full sell mode.
- Short sellers are in control of the price action with several technical weapons as proof.
- Buyers will want to step in but not before the sellers have taken their profit.

Elrond (EGLD) is not in a good place for the moment. Sellers have taken over from the buyers after those same buyers tried to attack $161. However, that failed, and since then price action is trending down with little attempt from buyers to support EGLD.
On August 20, buyers were still very much in control, but sellers took over after a failed break higher of the $161 level. Since then, price action is trending downward with that red descending trend line marked up on the charts. The next red flag comes when Elrond breaks the orange ascending trend line four times and today is barely able to get above in the price action. To make matters even worse for buyers, a clear rejection of the R2 monthly pivot at $137 has pushed EGLD to break the 55-day Simple Moving Average (SMA) to the downside around $129.
Buyers are getting squeezed out of their positions and taking profits in favor of short sellers eagerly taking over
With that said, it is still quite a long way down for Elrond to offer some support. The first fundamental level to mark upon the charts is at $113. That level takes us back to July 5, when buyers attempted to raise prices, but the attempt faded. This time this level can act as support, together with the monthly R1 resistance level just below. This makes it a double bottom where many short-sellers will take profit.
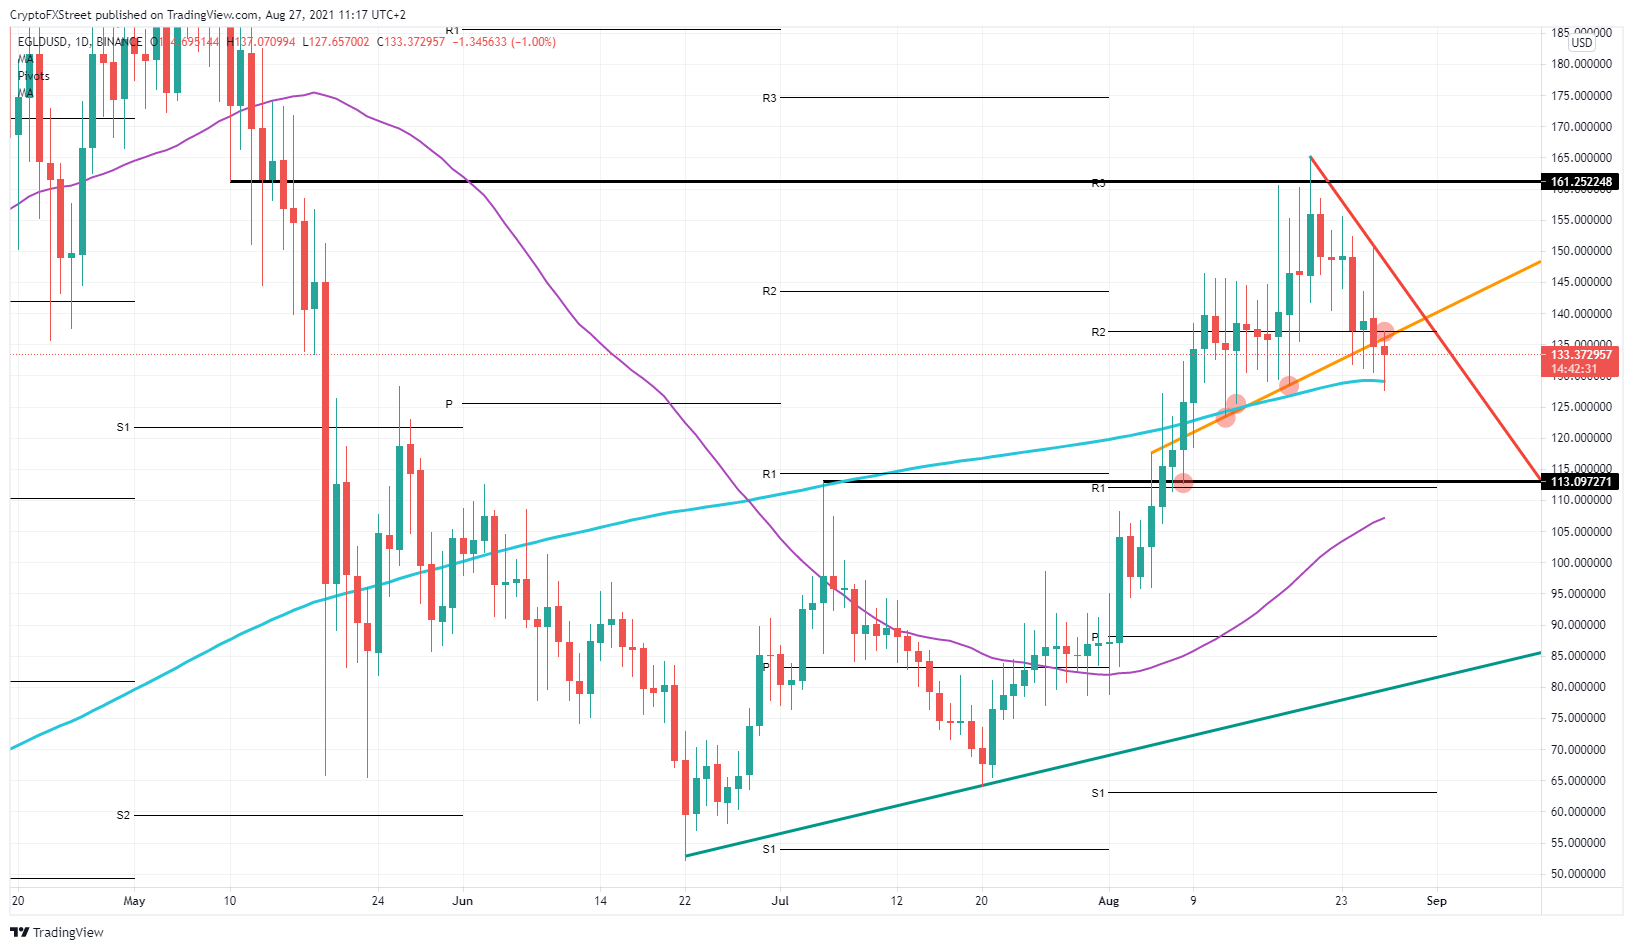
EGLD/USD daily chart
It looks like these sellers are very much in control, and buyers will wait for the right opportunity where profit will be taken. Buyers can then run up price action, make short-sellers step entirely out of their positions and regain control.
Should sentiment change back to a positive spin, expect a retest of the orange ascending trend line and next to that red descending trend line before buyers can attempt to do a second test of $161.
Author

Filip Lagaart
FXStreet
Filip Lagaart is a former sales/trader with over 15 years of financial markets expertise under its belt.


