Elrond Price Forecast: EGLD bearish impulses threaten slump to $100
- The SuperTrend indicator recently presented a signal to short Elrond on the 4-hour chart.
- The persistent declines from the high at $165 are likely to rise, breaking under the descending channel's middle boundary.
- The TD Sequential indicator recently presented a couple of buy signals hinting at possible recovery.

Elrond has sustained a downtrend for over seven days and, after the recovery in the first week of March, hit a barrier at $165. The declines increased momentum amid Monday's widespread bearish wave. Meanwhile, EGLD struggles to hold onto a key technical pattern's support.
Elrond hunting for formidable support area
Elrond is pivotal at the descending channel's middle boundary. A break under this level will see the token's bearish leg extend under $120 and test the channel's lower edge. Overhead pressure is made apparent by the trading beneath all the applied moving averages. Note that continued downward action could lead to panic-selling among investors, thus opening the road for losses toward $100.
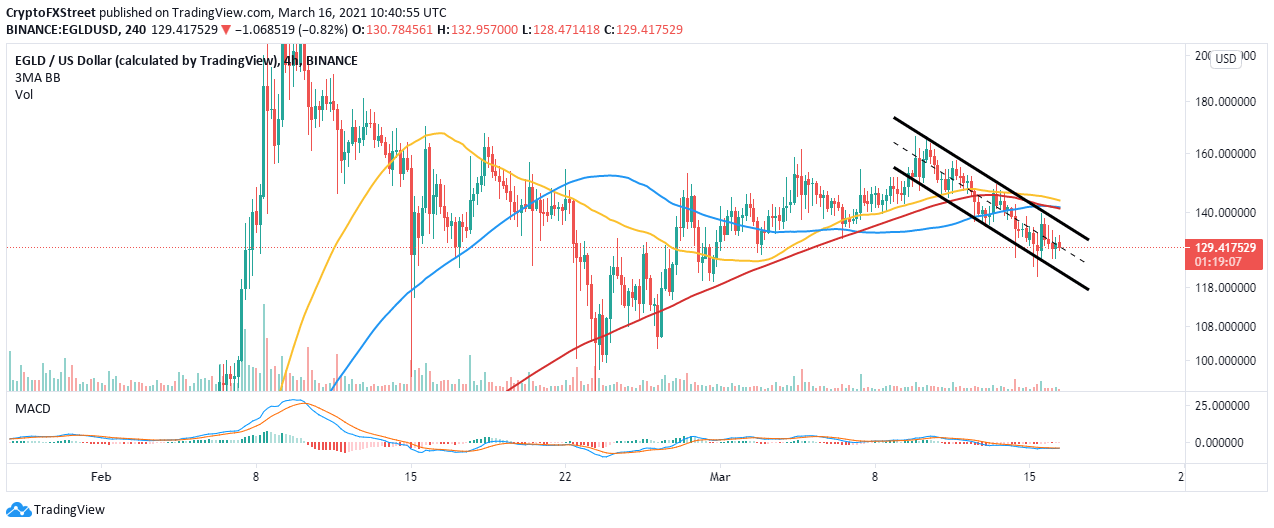
EGLD/USD 4-hour chart
The-hour SuperTrend indicator recently flipped massively bearish, suggesting that it was time to short Elrond. This indicator gives long-term trend signals. When the line turns red, it implies it is time to sell. On the other, when the line turns green and flips under the price, which suggests a time to buy the asset.
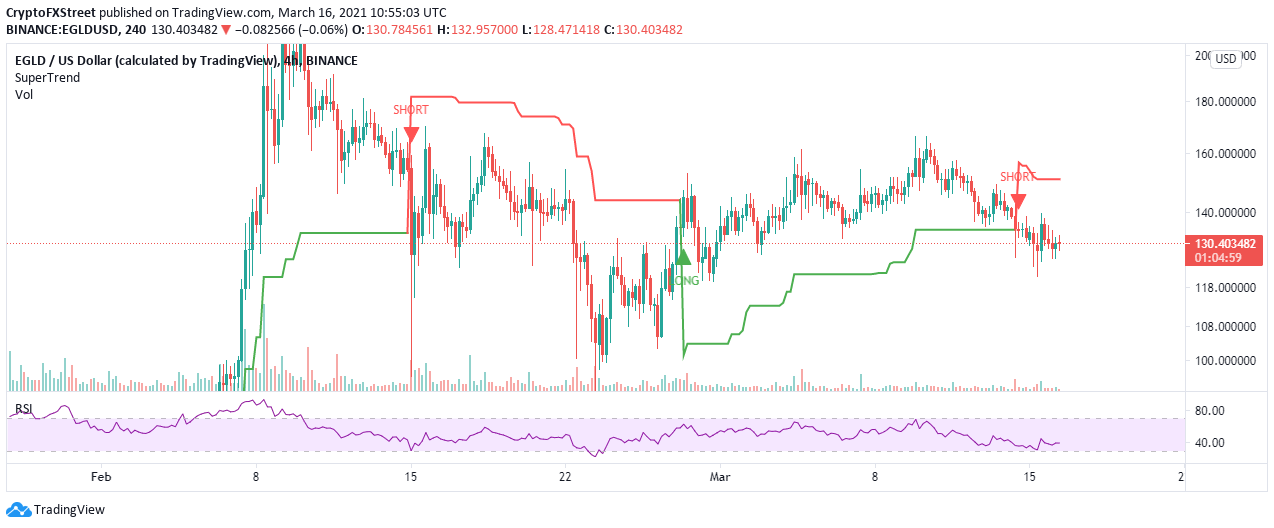
EGLD/USD 4-hour chart
Looking at the other side of the fence
The TD Sequential indicator has presented a couple of buy signals on the 4-hour and the 12-hour charts. These calls to buy in manifested in a red nine candlesticks and hint at the bearish momentum exhaustion as bullish impulse lingers.
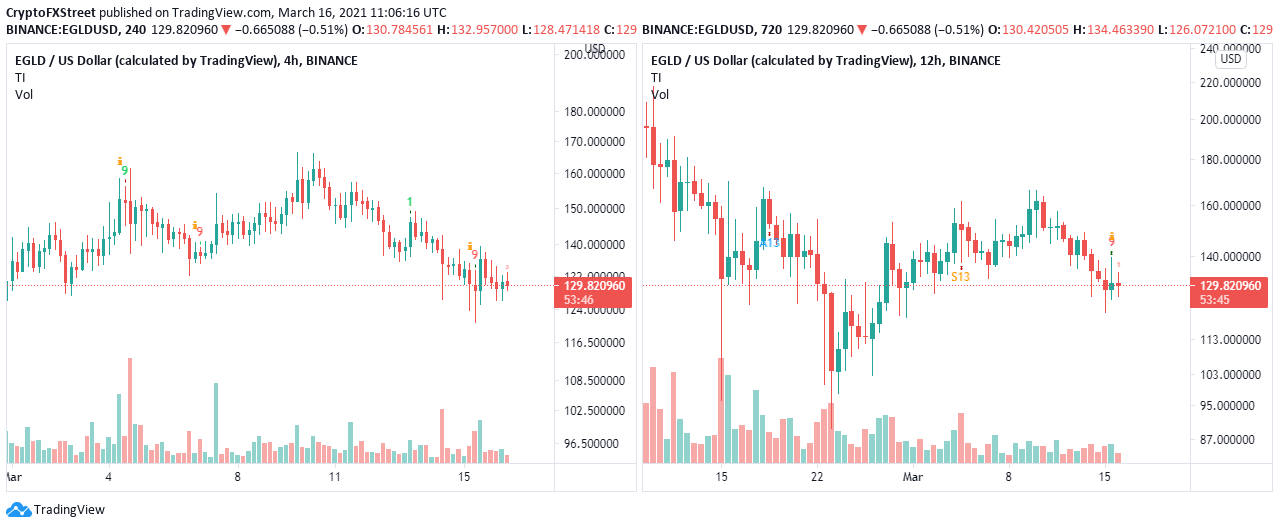
EGLD/USD 4/12 hour charts
On the upside, if the channel's middle support holds, we are likely to see the calls to buy Elrond validated. Price action above the descending channel would trigger massive buy orders as EGLD sprints toward $200.
Author

John Isige
FXStreet
John Isige is a seasoned cryptocurrency journalist and markets analyst committed to delivering high-quality, actionable insights tailored to traders, investors, and crypto enthusiasts. He enjoys deep dives into emerging Web3 tren


