Elrond forms bull trap anticipating 25% downturn
- Elrond price is clawing back, paring some losses from the previous day.
- Bulls are getting rejected at $208.
- More downturns to come as a bull trap looks to be forming.

Elrond (EGLD) price has been in recovery after the gloomy intraday Monday session. Then the correction followed after a break lower on Sunday. Price action has pared a bit back from the losses, but bulls face issues at $207. A close above is essential, because otherwise a bull trap will be formed, and sellers could run EGLD price down to $161.
Elrond price is make-or-break, and it is up to bulls to convince hesitant buyers
Elrond price headed lower this weekend after bulls attempted to break $300. Instead, price action faded and started to form what looked like a head-and-shoulders pattern. Sellers saw the rejection on Sunday at the intermediary top line and entered in total for a short squeeze. Bulls started to buy in at $180 and caught the falling knife. In the meantime, EGLD price clawed back up to $208.
EGLD price is facing around $208, the monthly R1 resistance level, and bulls are seeing a rejection of that level. Any further upside looks muted for now. Sellers are defending this level and are matching the volume from the profit-taking that buyers conduct around here. This unfolding situation spells issues for the uptrend in EGLD price as sellers comfortably match the volume and might cause another fade.
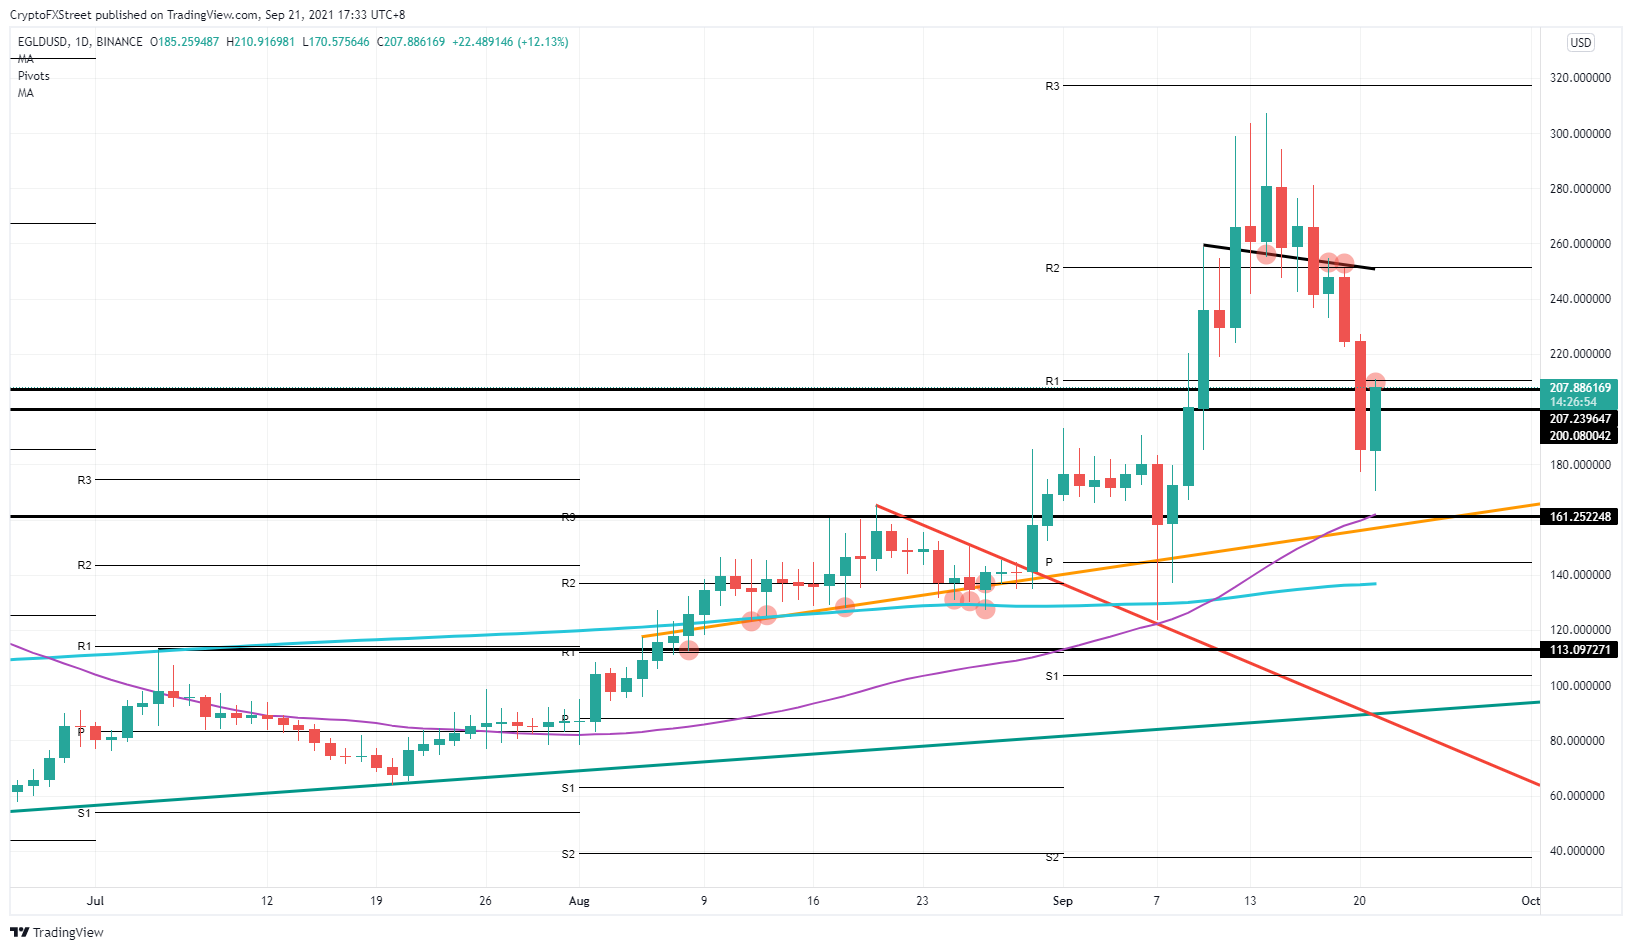
EGLD/USD daily chart
With Elrond price fading, a drop toward $161 is in the cards as this is the first interesting point of support where sellers would take their profit. Not only does $161 have some historical relevance, but it also has the 55-day Simple Moving Average (SMA) coming in and a short-term orange ascending trend line. Thus, there are three solid reasons that sellers will use to lock in profit, making it a much better entry level for EGLD bulls.
With an additional positive Catalyst, Elrond price could break above $207, which would convince hesitant buyers to come in. Expect from there a further ramp-up in price action toward $250. That level would fall in line with the intermediary black top line from the head-and-shoulders pattern.
Like this article? Help us with some feedback by answering this survey:
Author

Filip Lagaart
FXStreet
Filip Lagaart is a former sales/trader with over 15 years of financial markets expertise under its belt.



