Ethereum price analysis: Short term and long term both say we are not done yet
- Short term chart says a this fall has more loegs.
- Long term charts in sync with it.

Ethereum bears would love to see the short term as well as long term charts of Ethereum which has all the signs of pain and there is some more time before prices can stabilise in this downfall that started few days ago.
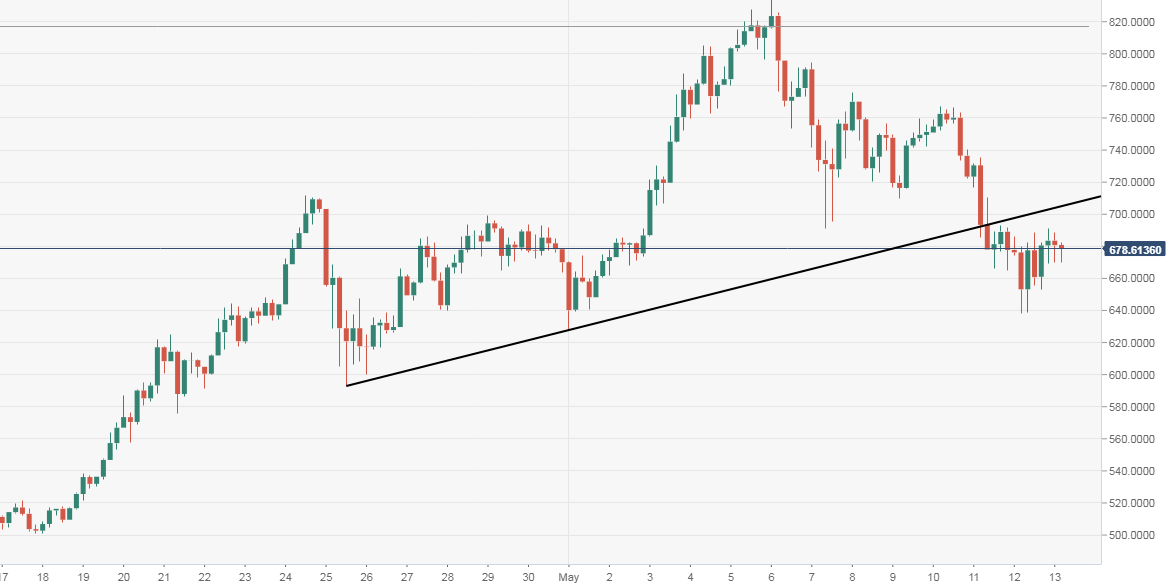
ETH/USD is down about a percent at $677.82 in a low ranged, low volatility trading day on the Sunday. On the 240-minute chart, after the breakdown earlier this week, the price actoin shows it could easily fall towards $660-640 again.
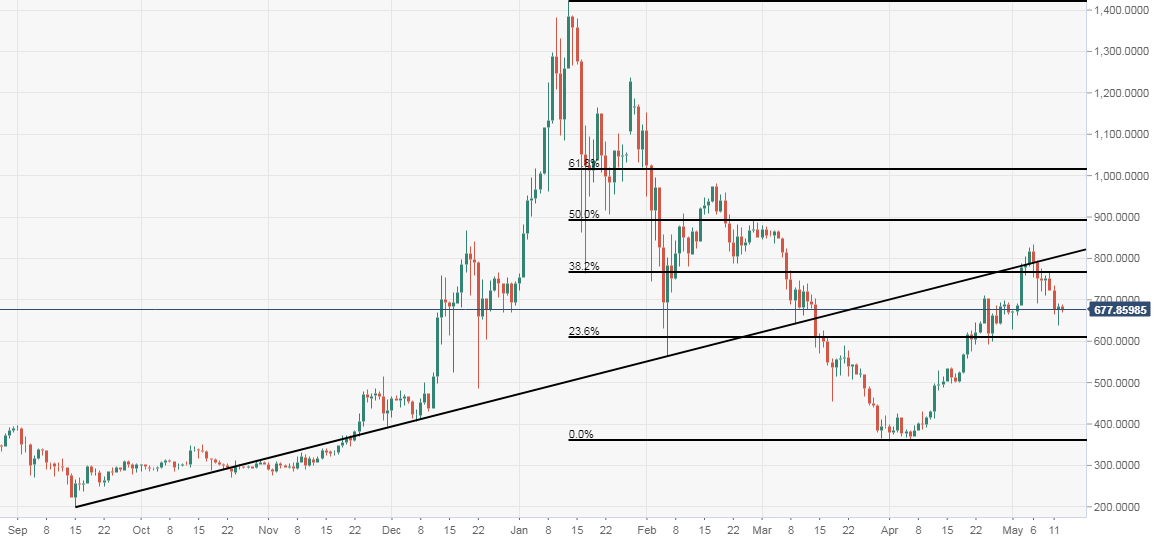
On the daily charts, $600-620 is where ETH might find some support, not before that. $610 is where 23.6 percent fibonacci retracement of earlier fall is placed and ETH bulls should try all their might to defend this level to bounce back.
ETH/USD 240-minute chart:
ETH/USD daily chart:
Author

Manoj B Rawal
Independent Analyst
Manoj B Rawal, financial markets professional with about 11 years of experience in writing, editing and advising on stocks, currencies and fixed income.


