Downside risk for Cardano limited to $1.60 as ADA struggles to find support
- Cardano price continues to underperform the broader cryptocurrency market.
- Twelfth week in a row in the current downtrend.
- Massive bear trap developing on the daily chart.

Cardano price has consistently failed to find buyers at any support zones on the daily chart despite prime conditions. However, that behavior may soon change as one of Cardano’s oscillators has hit a new all-time low.
Cardano price action to surprise the entire cryptocurrency market with a massive spike higher
Cardano price on its daily Ichimoku chart is overwhelmingly bearish. Every condition required for an Ideal Bearish Ichimoku Breakout is present on the daily chart:
- Future Senkou Span A below Future Senkou Span B
- The current close is below the Cloud (below Senkou Span A and Senkou Span B)
- The current close is below the Tenkan-Sen and Kijun-Sen.
- The Chikou Span is below the candlesticks and in open space (won’t intercept the body of any candlesticks over the next five to ten periods).
However, two variables show Cardano price could experience an imminent, massive, bullish reversal. The first variable is the extensive gap between the bodies of the daily candlesticks and the Tenkan-Sen. The second, and most important, is the current value of the Composite Index.
Cardano’s Composite Index on the daily chart made history today when it dropped to -23.6.
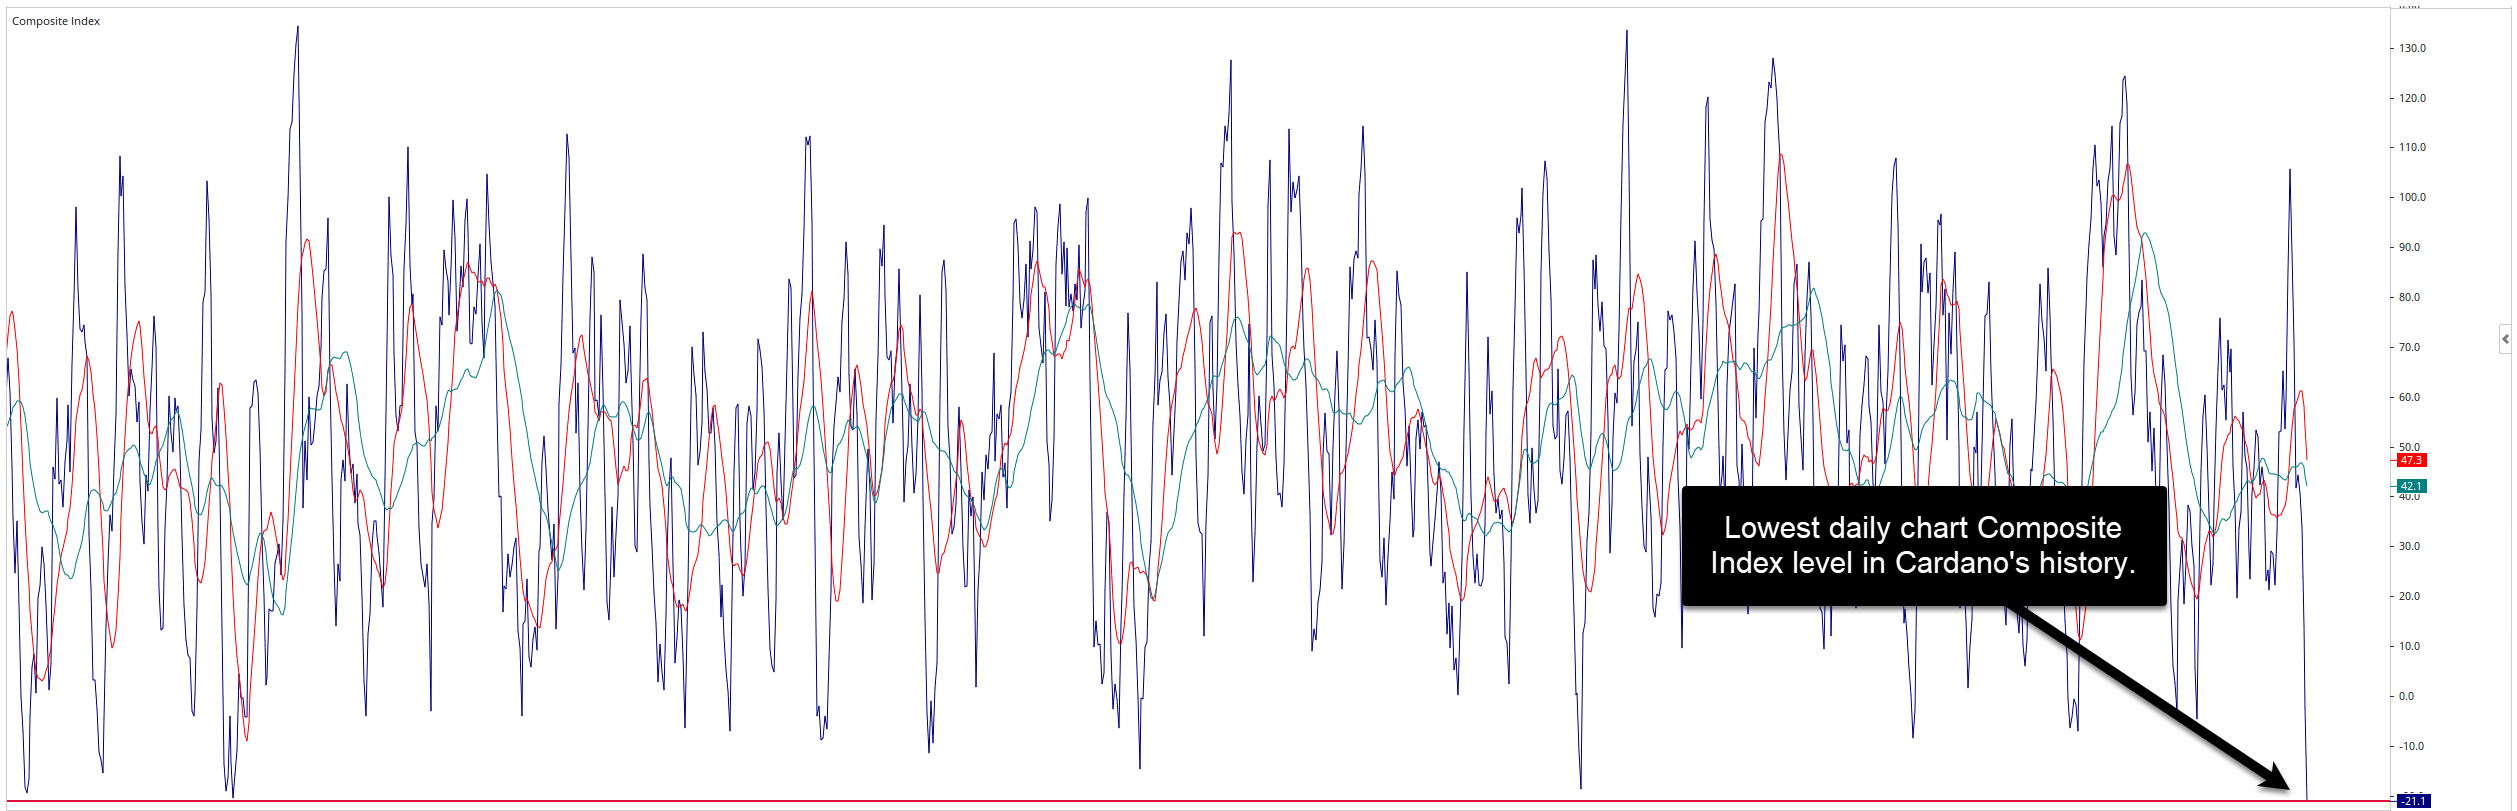
Daily Composite Index
The -23.6 value is a new historical all-time low in the Composite Index. The new all-time low positions Cardano’s daily chart into an explosive hidden bullish divergence setup. The word ‘volatility’ may not be sufficient to describe the price action that may occur over the next five to seven trading days. A flash-spike to the $3.00 range is likely.
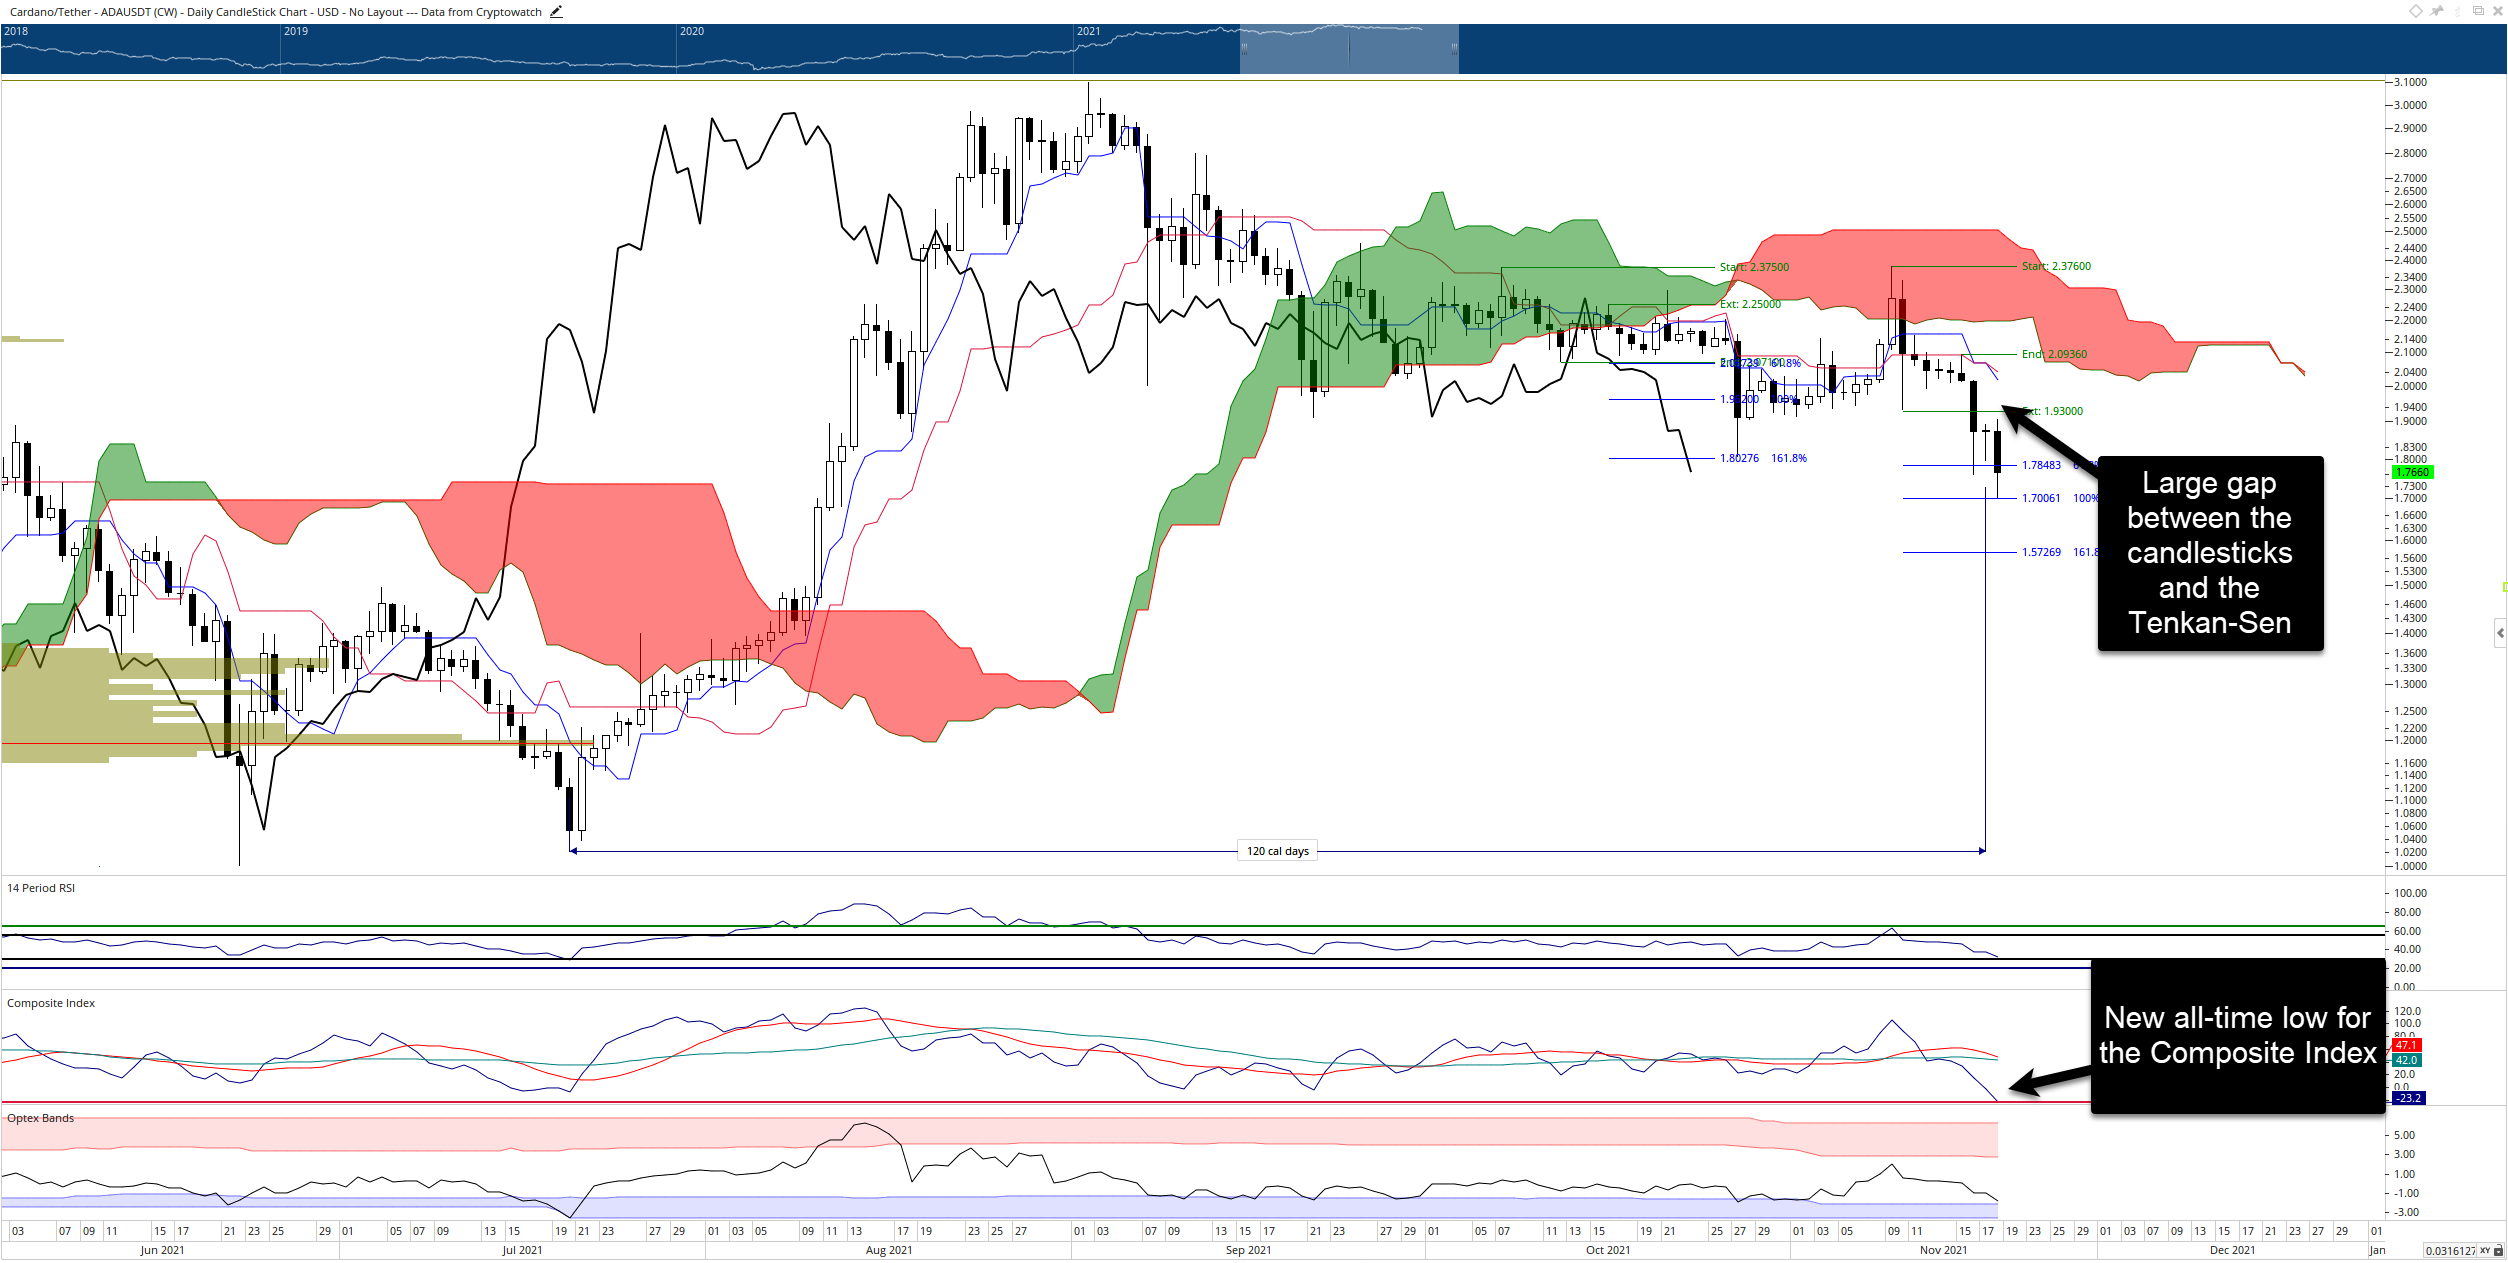
ADA/USD Daily Ichimoku Chart
Despite the hidden bullish divergence that could play out, there remain immediate downside risks. There is no Ichimoku support for Cardano price on the daily Ichimoku chart or the weekly Ichimoku chart. The only support that now exists is the Kijun-Sen on the three-week Ichimoku chart at $1.60.
Author

Jonathan Morgan
Independent Analyst
Jonathan has been working as an Independent future, forex, and cryptocurrency trader and analyst for 8 years. He also has been writing for the past 5 years.


