Dogecoin price rings with new-found optimism, but DOGE bulls are in for a fight
- Dogecoin price triggers a buy signal overnight, but buying commitment is limited.
- Only after falling 70% percent does the digital token undercut the 21-day simple moving average (SMA).
- Did DOGE and the digital media economy reconceptualize money in the 21st century?

Dogecoin price recovered from yesterday’s low, but the outlook is unclear. The potential for further selling and a general bearishness in the cryptocurrency complex should contain the eager speculators that jumped on the hammer candlestick buy signal earlier today.
Dogecoin ownership structure shifting from hodlers to cruisers and traders
By studying the activity of different classes of market speculators, it is possible to ascertain who is driving price traction and the sustainability of a given rally or decline. In the case of DOGE, the number of Hodlers (1YR+) owning the digital token has fallen from 77% in December 2020 to 58% this month, indicating that this segment of the market has used the sharp rally in April to raise cash. In contrast, the percentage of Traders (<1M) ownership has climbed from 5.5% in December 2020 to 15% in April as volatility rose significantly.
Such a change in the ownership profile leaves DOGE exposed to wider price swings on an intra-day basis and, potentially, less sustainable price traction as traders seek to capitalize on the short-term gyrations in the overall cryptocurrency market.
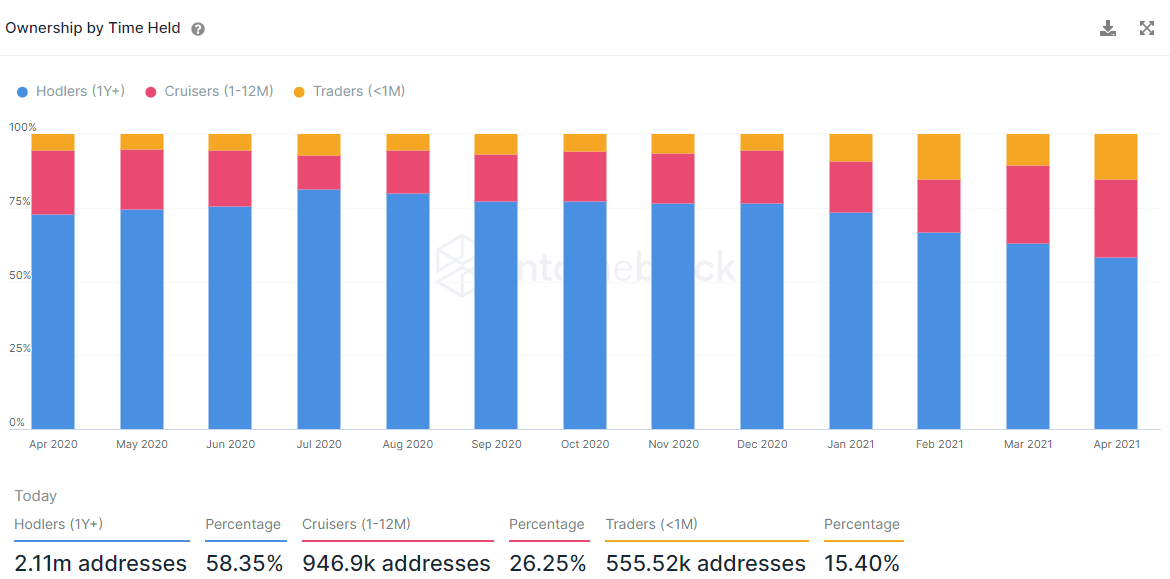
Source: Intheblock
The fluidity of the price action is represented in the Intheblock In/Out of the Money Around Price (IOMAP) data, creating hardened levels of support and resistance around the current price, with a slight bias in favor of out-of-the-money (resistance) addresses.
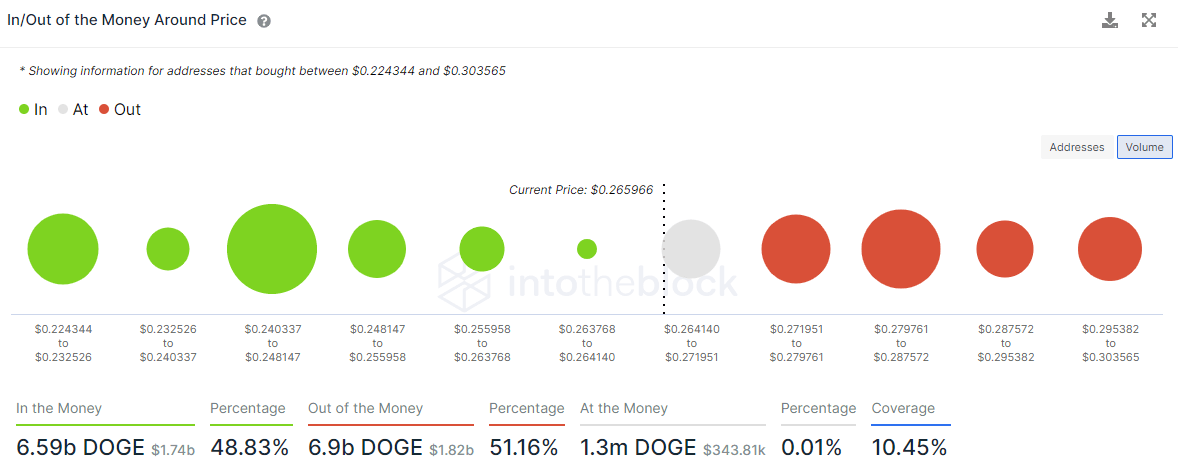
DOGE IOMAP data
Dogecoin price phenomenon is not for the weak-minded
The Dogecoin price pattern has transformed over the course of the last five days. On the intra-day charts, it began as a cup-with-handle base after the April 16 high but then evolved into a symmetrical triangle pattern before collapsing through the lower trendline on April 22. Yesterday DOGE closed with a hammer candlestick pattern that triggered a buy signal today as the price rose above the hammer’s high.
The Dogecoin price rebound yesterday was impressive, but it only puts the altcoin in a range of resistance that will prove a challenge to overcome. Speculators are better off being patient than pursuing an aggressive approach, despite the buy signal.
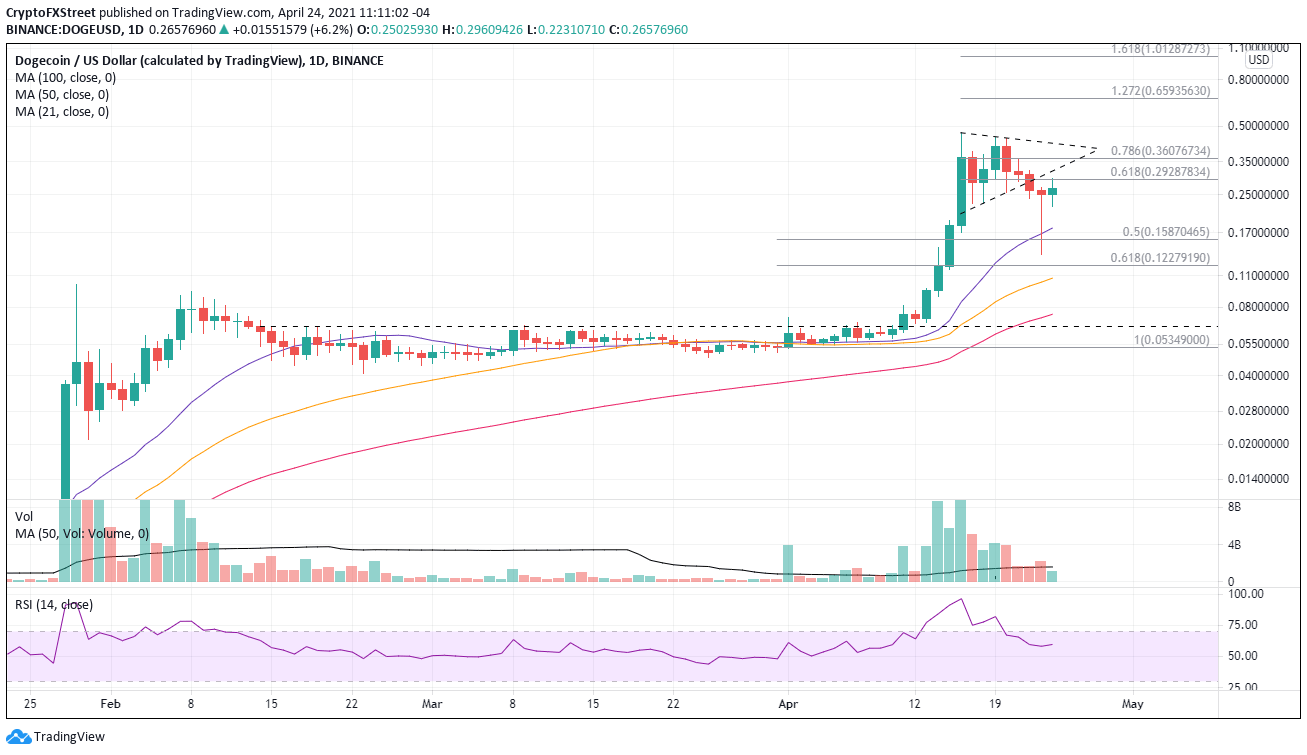
DOGE/USD daily chart
If a retest of the all-time high occurs, DOGE will need to overcome resistance at the 61.8% Fibonacci retracement at $0.293 and the lower trend line of the symmetrical triangle $0.312. Above the trend line is an air pocket until the triangle’s upper trend line at $0.421.
Author

Sheldon McIntyre, CMT
Independent Analyst
Sheldon has 24 years of investment experience holding various positions in companies based in the United States and Chile. His core competencies include BRIC and G-10 equity markets, swing and position trading and technical analysis.



