- Dogecoin price rejected by top of the $0.19 double bottom.
- DOGE now sees bulls trying to defend $0.16 – a historical and monthly S1 support level.
- A break below could trigger an aggressive sell-off, resulting in a 40% devaluation for Dogecoin.
Dogecoin (DOGE) price is continuing its downtrend which has strengthened after bears seized the opportunity to add even more short positions, following the rejection at the $0.19 ceiling. Currently, tailwinds look to be fading for cryptocurrencies and bulls are unlikely to find much external support to try and defend the $0.16 floor. A break below there could spiral into a price correction to under $0.1, holding a 40% possible devaluation for DOGE.
Dogecoin price sees bears targeting $0.09 to the downside
Dogecoin price took another leg lower in its downtrend this week, below $0.19. The DOGE price started to normalize after a turbulent weekend, with bulls trying to reclaim $0.19 but they got rejected as bears seized the momentum, squeezing them out of their positions. As price action in DOGE now looks to test $0.16, bulls are scrambling to defend both the historical level and the monthly S1 support level, but without any tailwinds behind them to help.
DOGE looks ripe for the break to the downside below $0.16, as not many elements seem to be standing in the way. Bears will likely have a smooth run to the downside with only the monthly S2 support around $0.10 and the historical support level at $0.09 standing in the way. The Relative Strength Index (RSI) will by then likely be trading highly in the oversold zone, indicating the correction will probably halt at these levels as buyers renter the market seeing an opportunity to pick up DOGE at a discount.
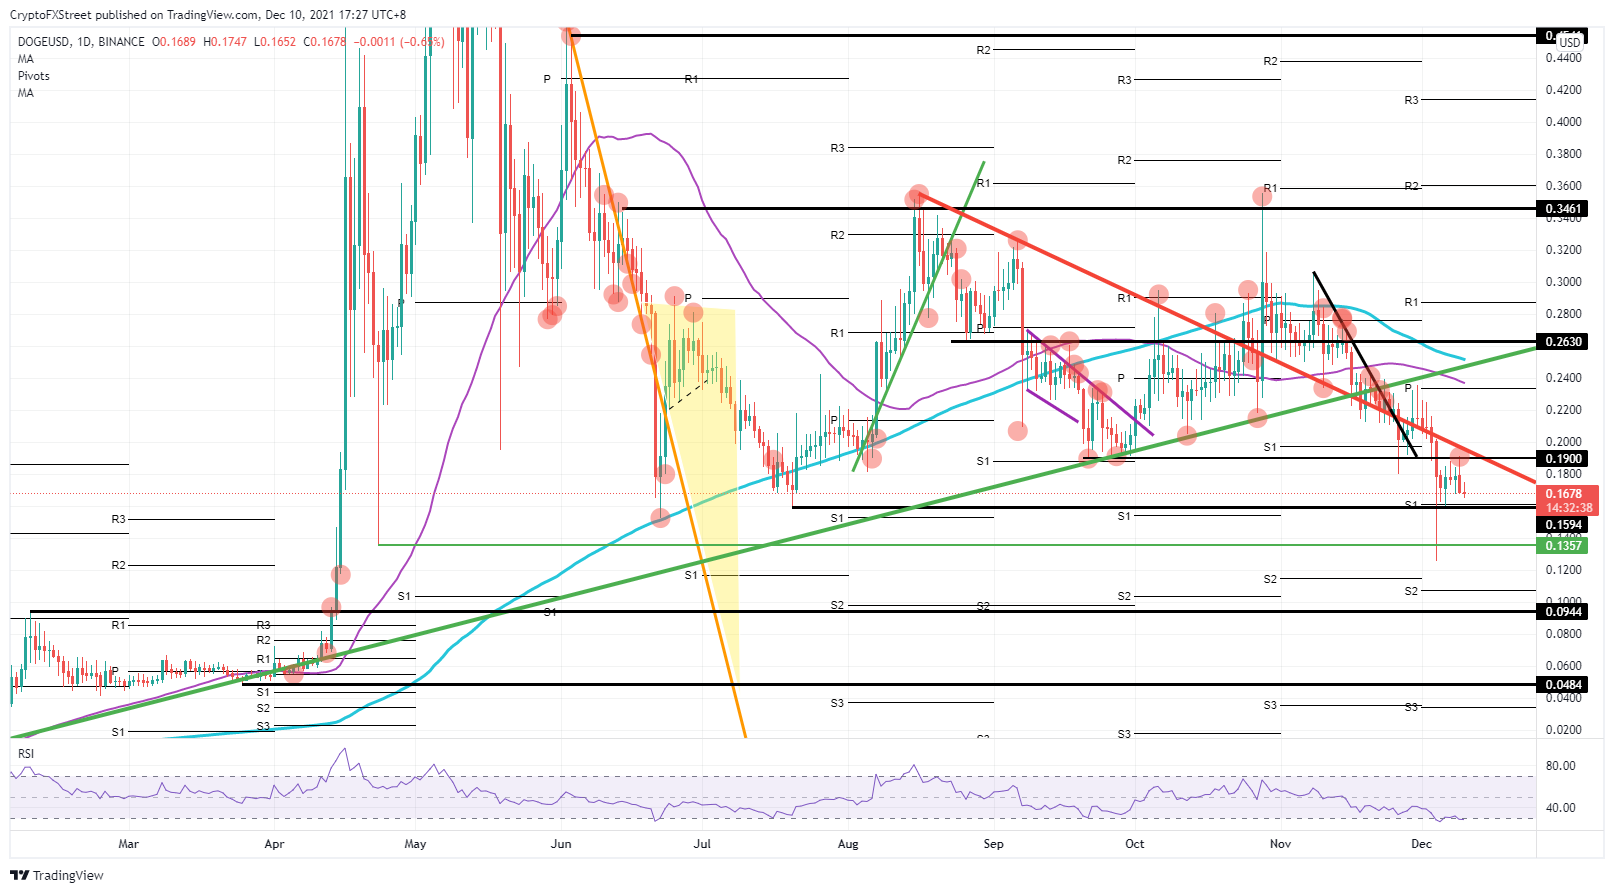
DOGE/USD daily chart
If bulls can defend and hold $0.16, a return to $0.19 is likely – but again with the risk of another rejection. If market sentiment turns more positive for crypto this could act as a catalyst to push DOGE price above $0.19 and see a return to possibly $0.26, depending on the strength and number of factors. The issue is that both the 55-day and the 200-day Simple Moving Averages are hovering just above the monthly pivot around $0.24, making it quite a challenge to reach $0.26 in one rally.
Information on these pages contains forward-looking statements that involve risks and uncertainties. Markets and instruments profiled on this page are for informational purposes only and should not in any way come across as a recommendation to buy or sell in these assets. You should do your own thorough research before making any investment decisions. FXStreet does not in any way guarantee that this information is free from mistakes, errors, or material misstatements. It also does not guarantee that this information is of a timely nature. Investing in Open Markets involves a great deal of risk, including the loss of all or a portion of your investment, as well as emotional distress. All risks, losses and costs associated with investing, including total loss of principal, are your responsibility. The views and opinions expressed in this article are those of the authors and do not necessarily reflect the official policy or position of FXStreet nor its advertisers. The author will not be held responsible for information that is found at the end of links posted on this page.
If not otherwise explicitly mentioned in the body of the article, at the time of writing, the author has no position in any stock mentioned in this article and no business relationship with any company mentioned. The author has not received compensation for writing this article, other than from FXStreet.
FXStreet and the author do not provide personalized recommendations. The author makes no representations as to the accuracy, completeness, or suitability of this information. FXStreet and the author will not be liable for any errors, omissions or any losses, injuries or damages arising from this information and its display or use. Errors and omissions excepted.
The author and FXStreet are not registered investment advisors and nothing in this article is intended to be investment advice.
Recommended Content
Editors’ Picks

Ripple Price Prediction: How tokenized treasuries could accelerate XRP to $10 by end-2025
The adoption of cryptocurrency-related financial products, including tokenized treasuries, is on overdrive globally, with the focus now shifting to robust networks such as Ripple's XRP Ledger (XRPL).

Sei rallies as Wyoming selects protocol for WYST stablecoin pilot
Sei extends gains above $0.21, decoupling the token from the broader crypto market amid low sentiment and macroeconomic uncertainty. The Wyoming Stable Token Commission selects Sei Network as a candidate blockchain for the WYST, the first fiat-backed stablecoin issued by a US state.

Crypto Today: Bitcoin, Ethereum, XRP nudge higher as geopolitical tensions take a backseat
Bitcoin bulls step up, pushing the price above $106,000, as Trump said he would delay his decision about launching strikes on Iran for up to two weeks. Ethereum rebounds from the 200-day EMA support at $2,477 amid steady interest in the derivatives market.

Solana eyes trend reversal as bearish momentum bottoms out above $140
Solana experiences a minor uptick of under 1% at press time on Friday, with multiple long shadow candles forming above $140 as bearish momentum fades off. The optimism surrounding Solana is on the rise, as evidenced by the SOL Open Interest reaching a weekly high.

Bitcoin Weekly Forecast: The calm before the storm
Bitcoin (BTC) price remains steady above a key support level, trading slightly above $106,000 at the time of writing on Friday. The uncertainty looms as geopolitical tensions between Iran and Israel show no sign yet of an exit strategy from either side.

The Best brokers to trade EUR/USD
SPONSORED Discover the top brokers for trading EUR/USD in 2025. Our list features brokers with competitive spreads, fast execution, and powerful platforms. Whether you're a beginner or an expert, find the right partner to navigate the dynamic Forex market.