Dogecoin Price Prediction: DOGE loses momentum, but upswing could still evolve
- Dogecoin price crashes 35% after the hyped “dogeday420” fails to gather steam.
- Despite losing its upswing momentum, the meme coin could still surge if it bounces off the immediate demand.
- On-chain metrics point to a grim outlook for DOGE.

Dogecoin price slows down its collapse as it approaches a crucial barrier. If the buyers make a comeback here, DOGE could propel to the local top.
Dogecoin price at crossroads
Dogecoin price faced an intense sell-off as it failed to perform during the much-anticipated “Doge day” on April 20. Since then, DOGE has dropped nearly 35% to a crucial barrier.
This demand zone ranges from $0.227 to $0.269 and is the best chance buyers have at rescuing the meme-themed coin from sellers’ wrath, especially since it coincides with the 50 Simple Moving Average (SMA) on the 4-hour chart. In case Dogecoin price sees a resurgence of investors or a spike in buying pressure due to an unforeseen event, DOGE might retest the local top at $0.448 after a 65% upswing.
A confirmation of this upswing will arrive after DOGE produces a decisive close above the 50% Fibonacci retracement level at $0.319.
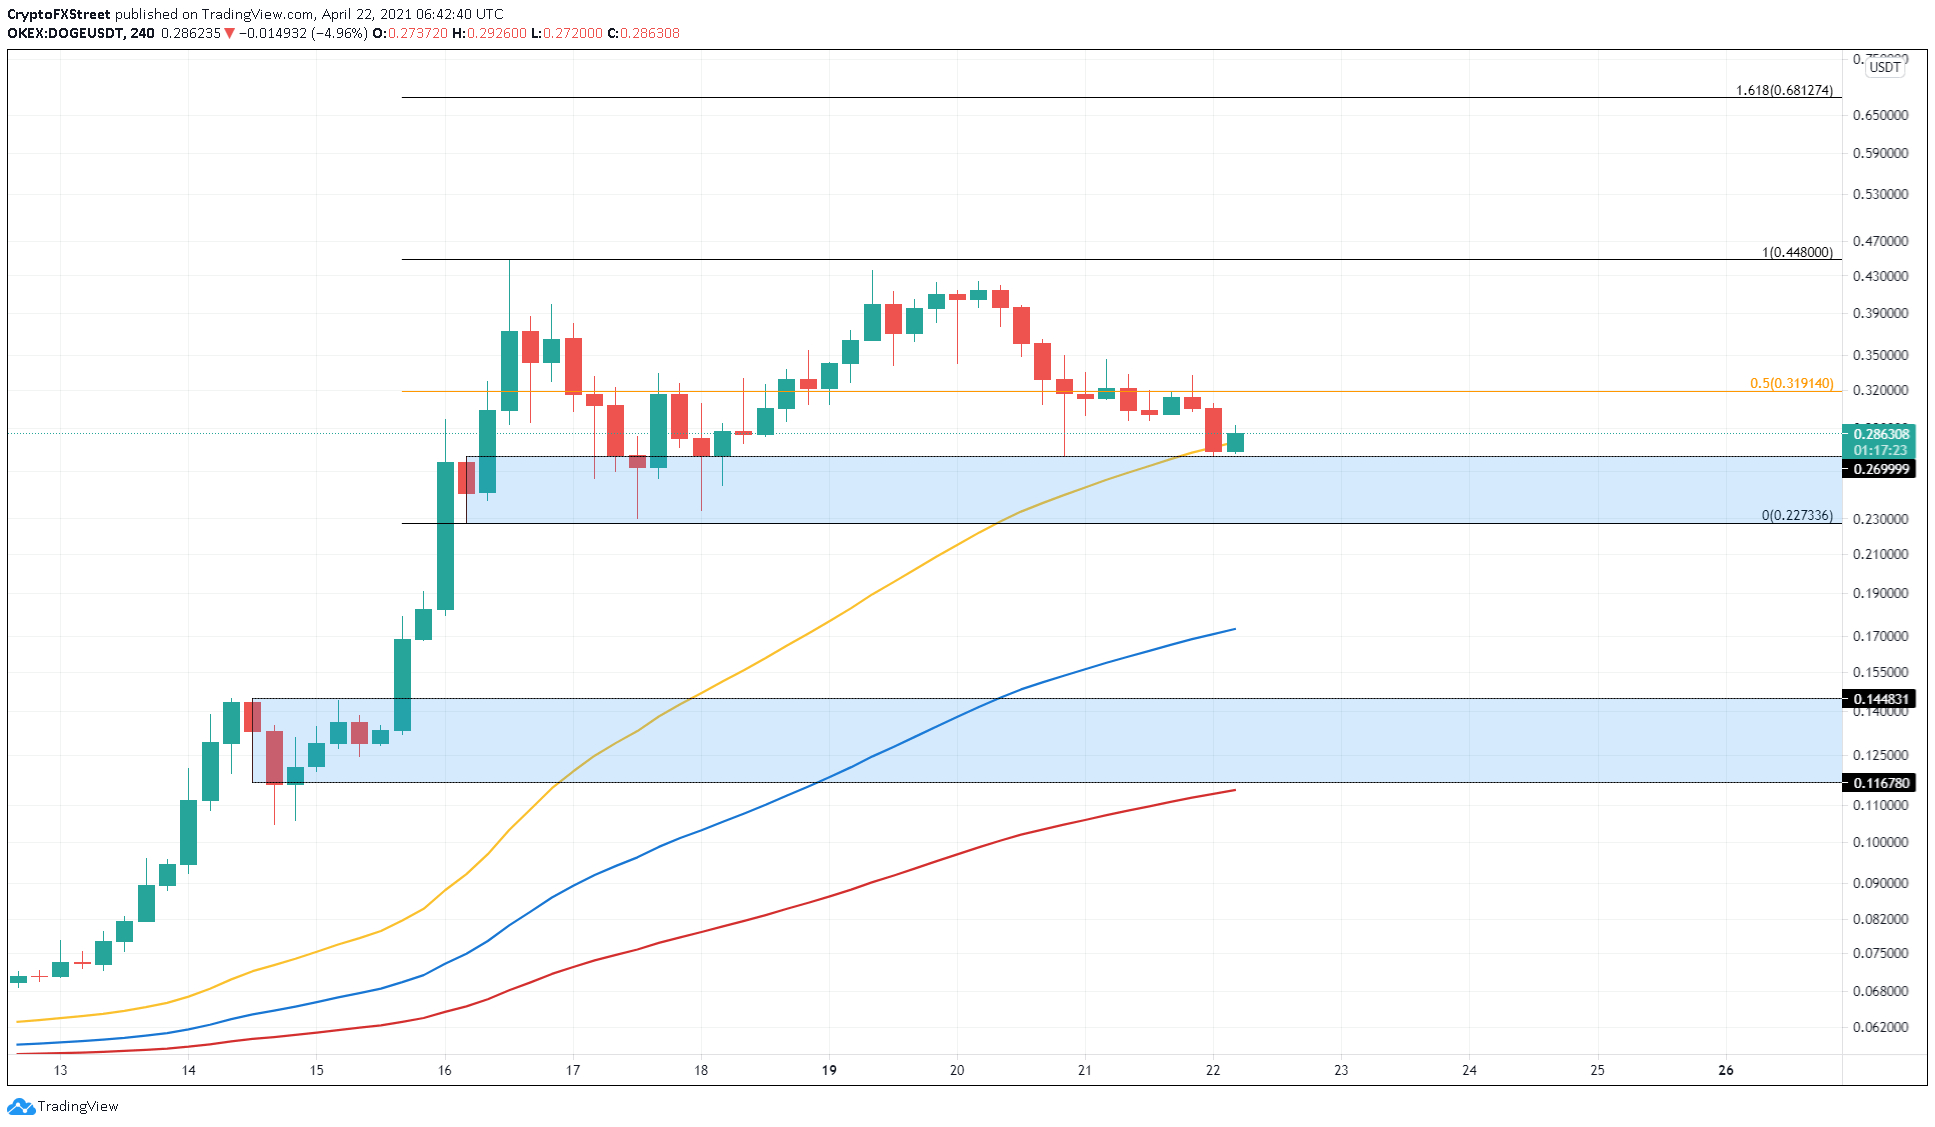
DOGE/USDT 4-hour chart
While the technicals point to a bullish picture if the demand zone holds, on-chain metrics suggest that the investors are disinterested in the meme coin and are slowly pulling out of DOGE.
If this trend continues to follow, Dogecoin price might see a range-bound, non-volatile move for the foreseeable future.
According to IntoTheBlock’s In/Out of the Money Around Price (IOMAP) model, nearly 47,000 addresses that purchased 12.63 billion DOGE at $0.32 are “Out of the Money.” Hence, a short-term spike in buying pressure will face selling pressure around this level from investors who might want to break even.
Additionally, the lack of support levels makes it challenging for the bulls to surge higher, adding credence to a potential drop.
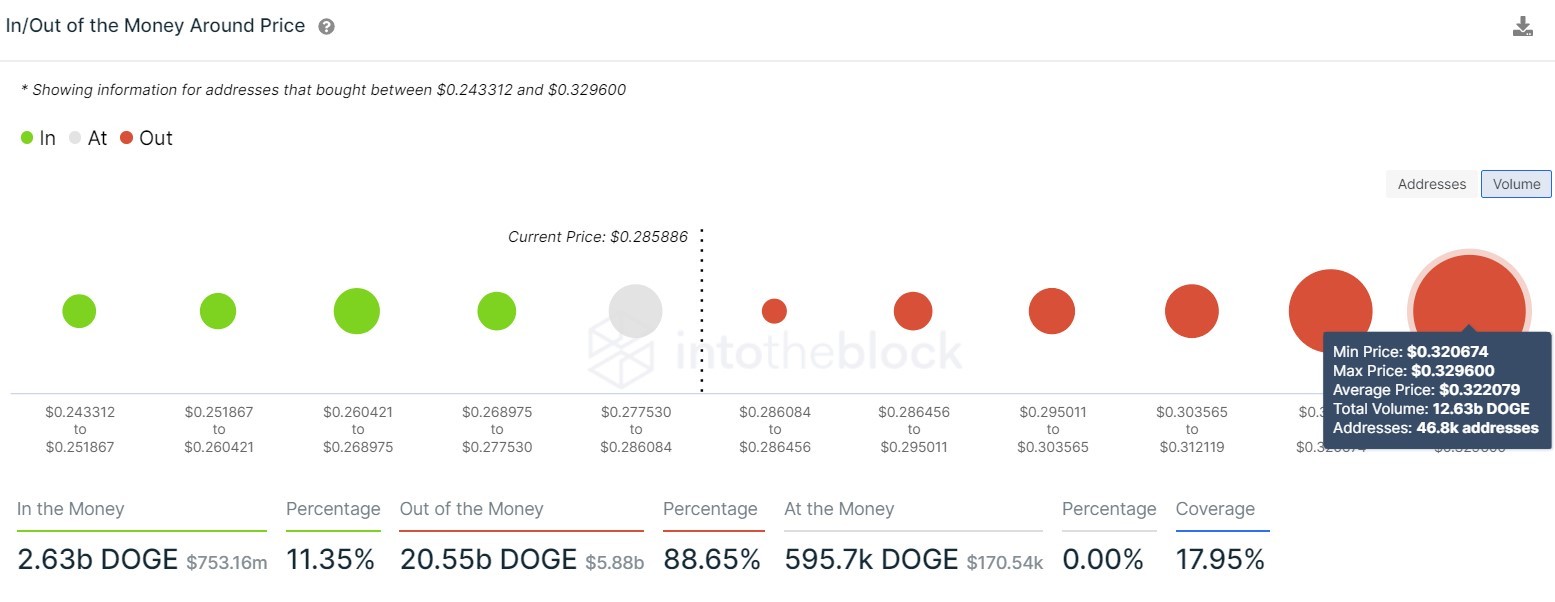
DOGE IOMAP chart
A similar pessimistic outlook is seen across the number of new addresses, which has dropped from 160,000 to 56,000 since April 16. This 65% slump provides headwinds for the bullish momentum.
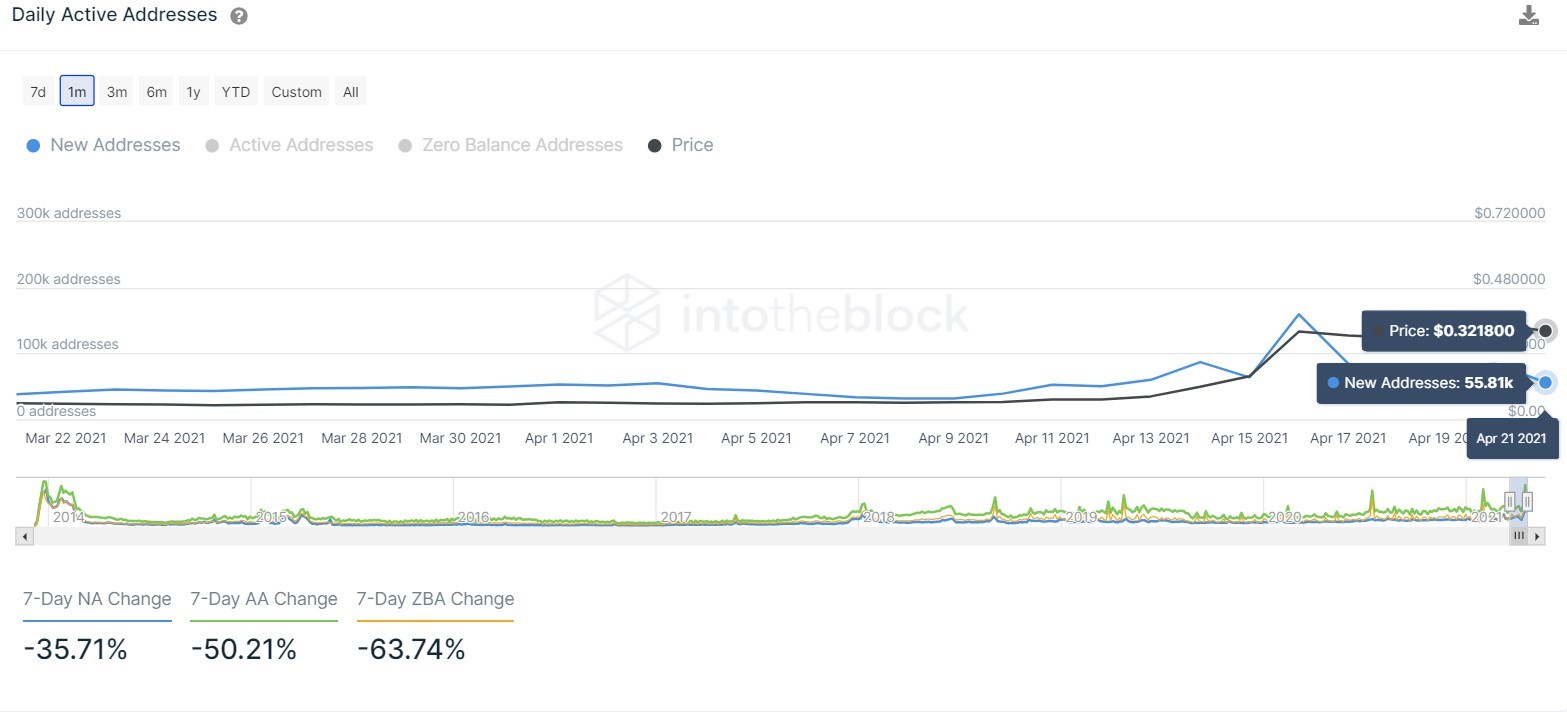
DOGE daily new addresses chart
The number of transactions worth $100,000 or more has crashed from roughly 11,000 transactions on April 16 to 3,300 on April 21, a 70% crash.
This drop-off can be used as a proxy to investors’ interest. Fleeing capital from the Dogecoin network paints a bearish picture for Dogecoin price, suggesting that these market participants are reallocating their holdings or booking profit.
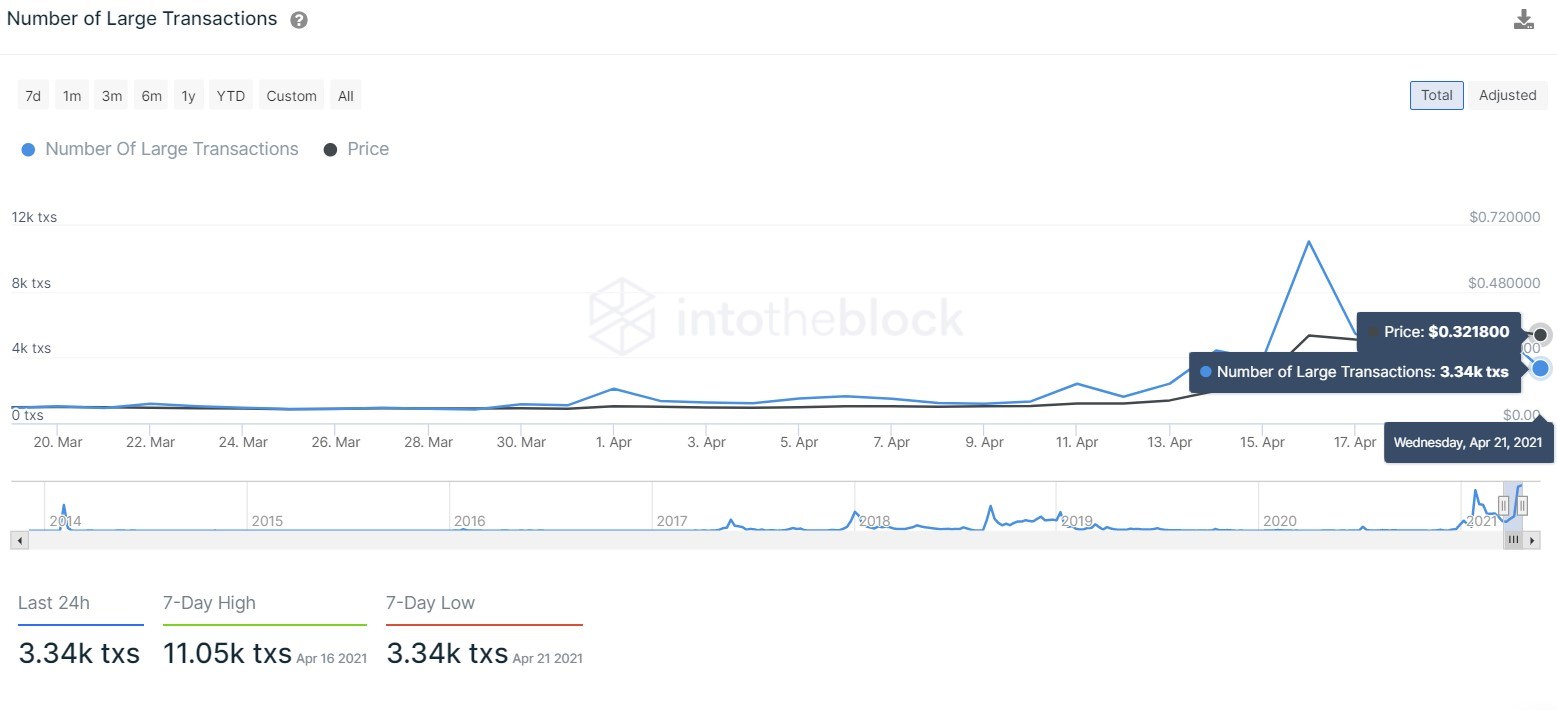
DOGE large transactions chart
Therefore, if the said demand zone is breached with a solid 4-hour candlestick close below $0.227, it would invalidate the bullish outlook and may trigger a 35% sell-off to the subsequent area of support that stretches from $0.116 to $0.144.
This crash could make a pitstop at the 100 SMA at $0.173.
Author

Akash Girimath
FXStreet
Akash Girimath is a Mechanical Engineer interested in the chaos of the financial markets. Trying to make sense of this convoluted yet fascinating space, he switched his engineering job to become a crypto reporter and analyst.



